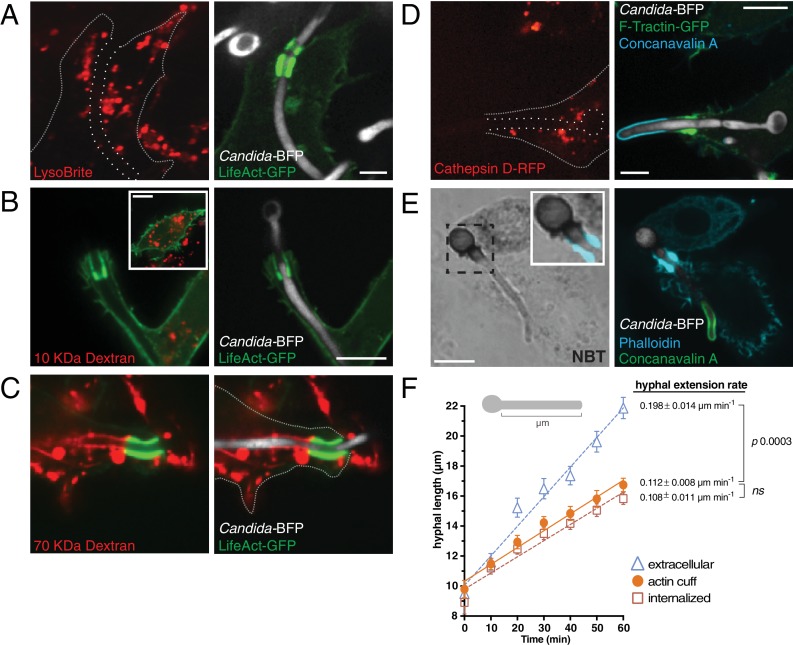
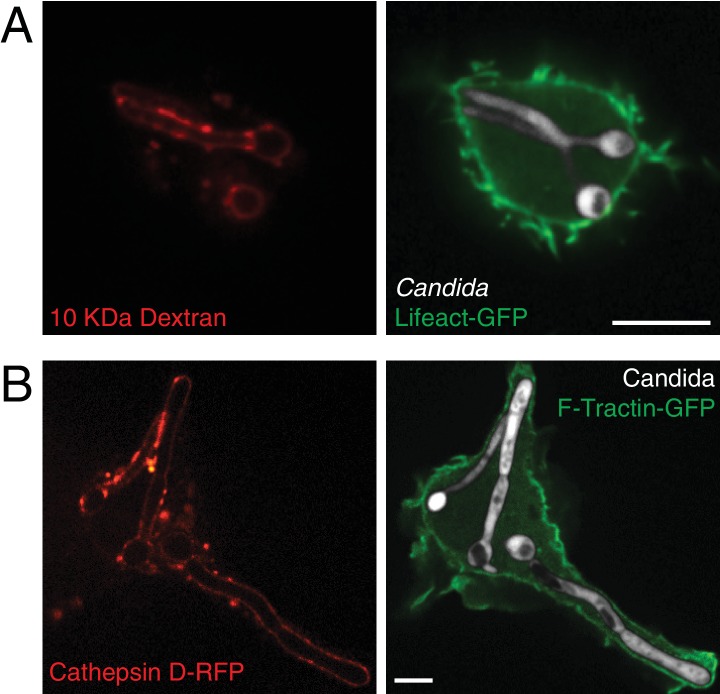
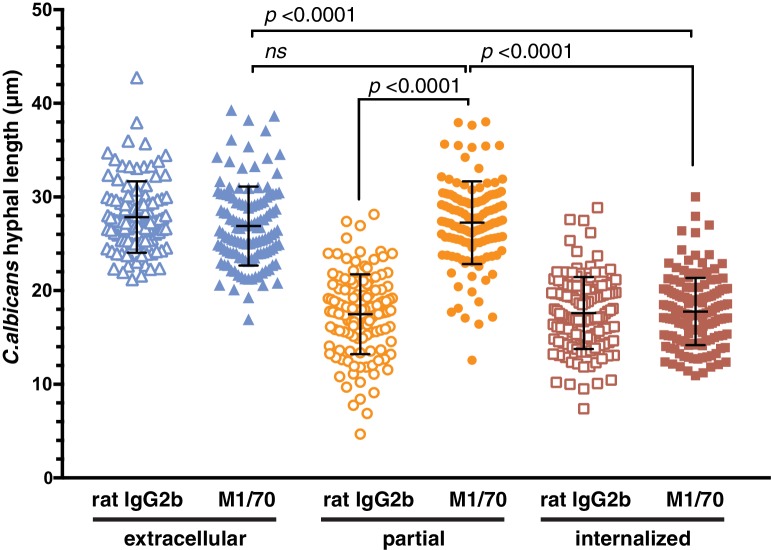
Figure 10. Analysis of the antimicrobial environment within the frustrated phagosome.
(A) After phagocytosis of Candida-BFP hyphae by RAW-Dectin1 cells, acidic compartments were labeled with LysoBrite (red). The open hyphal phagocytic cup is marked with a dotted outline. Actin was visualized using transfected LifeAct-GFP. Scale bar: 5 μm. (B and C) Prior to phagocytosis of C. albicans hyphae, the lysosomes of RAW-Dectin1 cells were loaded with (B) 10 kDa or (C) 70 kDa fluorescent dextran (red). After phagocytosis, retention of dextran in the frustrated hyphal phagocytic cup was assessed by live cell microscopy. Actin was visualized using transfected LifeAct-GFP. Scale bars: 10 μm. (D) Retention of lysosomal hydrolases was assessed using transfected cathepsin D-RFP as a marker (red). Following phagocytosis and fixation, extracellular C. albicans was stained using Alexa647-conjugated concanavalin A (blue). Actin was visualized using transfected F-Tractin-GFP. Frustrated hyphal phagocytic cup marked with a dotted outline. Scale bar: 5 μm. (E) Generation of superoxide within the frustrated hyphal cup was detected using NBT. Following phagocytosis and fixation, extracellular C. albicans was stained using Alexa594 conjugated concanavalin A (red). Actin was stained using fluorescent phalloidin (blue). Inset shows merged image of formazan precipitate and the actin cuff. Scale bar: 5 μm. Images are representative of ≥30 fields from ≥3 separate experiments of each type. (F) Effect of the frustrated phagosome on C. albicans hyphal extension rate. After incubation with Candida-BFP hyphae for 10 min, RAW-Dectin1 cells transiently expressing F-Tractin-GFP were fixed at 10 min intervals, and extracellular C. albicans stained using fluorescent concanavalin A and visualized by confocal microscopy. The length of C. albicans hyphae (see (F), top) was measured for hyphae identified as extracellular (Δ), fully internalized (□) or partially internalized with actin cuffs (•), and the average hyphal length at each time-point and hyphal extension rate calculated. Average number of C. albicans per time-point was 55.0 ± 3.1. For each condition, four independent experiments were quantified, with ≥10 fields (37.5x) counted per replicate. p values calculated using the unpaired, 2-tailed students t-test. Data are means ±SEM.


