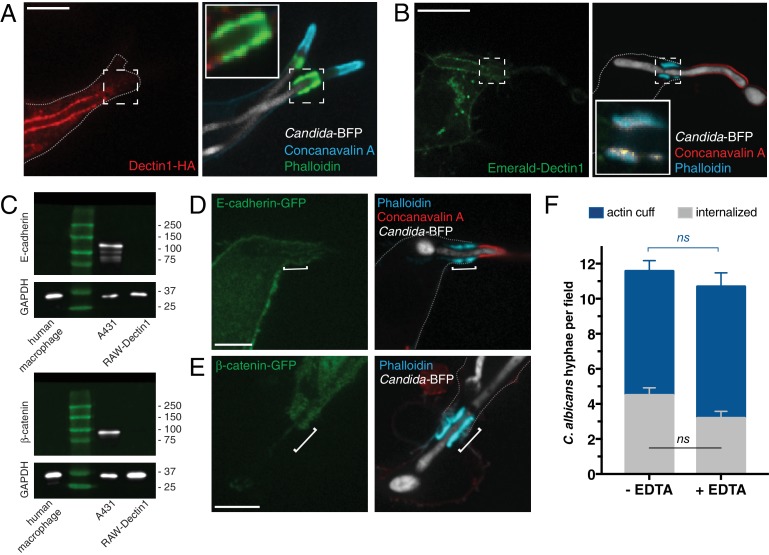
Figure 2. Assessing the contribution of Dectin1 and cadherin/catenin to the formation of the actin cuff.
After incubation with Candida-BFP hyphae, RAW-Dectin1 cells were fixed and monolayers stained and visualized as follows. (A) The distribution of Dectin1-HA was detected by immunostaining (red). Actin was stained using fluorescent phalloidin (green); concanavalin A (blue). Inset: actin cuff shows little colocalization (yellow) with Dectin1-HA. (B) Visualization of Emerald-Dectin1 (green). Actin was stained using fluorescent phalloidin (blue); concanavalin A (red). Inset: poor colocalization of actin cuff with Emerald-Dectin1, in yellow. (C) The expression of E-cadherin (top panel) and β-catenin (bottom panel) was assessed by immunoblotting in human macrophages, A431 and RAW-Dectin1 cells; GAPDH was used as loading control. Visualization of: (D) E-cadherin-GFP or (E) β-catenin-GFP transiently transfected into RAW-Dectin1 cells. For both (D) and (E), after phagocytosis and fixation, extracellular C. albicans was stained using Alexa594-conjugated concanavalin A (red), and actin stained using fluorescent phalloidin (blue). Scale bars: 5 μm. (F) RAW-Dectin1 cells were allowed to internalize C. albicans-hyphae in the presence or absence of 4 mM EDTA. Following phagocytosis, extracellular C. albicans was stained using concanavalin A, and actin stained with phalloidin. The number of C. albicans hyphae that were fully internalized or partially internalized with actin cuffs per 37.5x field was counted by confocal microscopy, and the average number per field calculated. Average number of C. albicans per field was 12.7 ± 1.0. For each condition, three independent experiments were quantified, with ≥15 fields counted per replicate. p value was calculated using the unpaired, 2-tailed students t-test. Data are means ±SEM.


