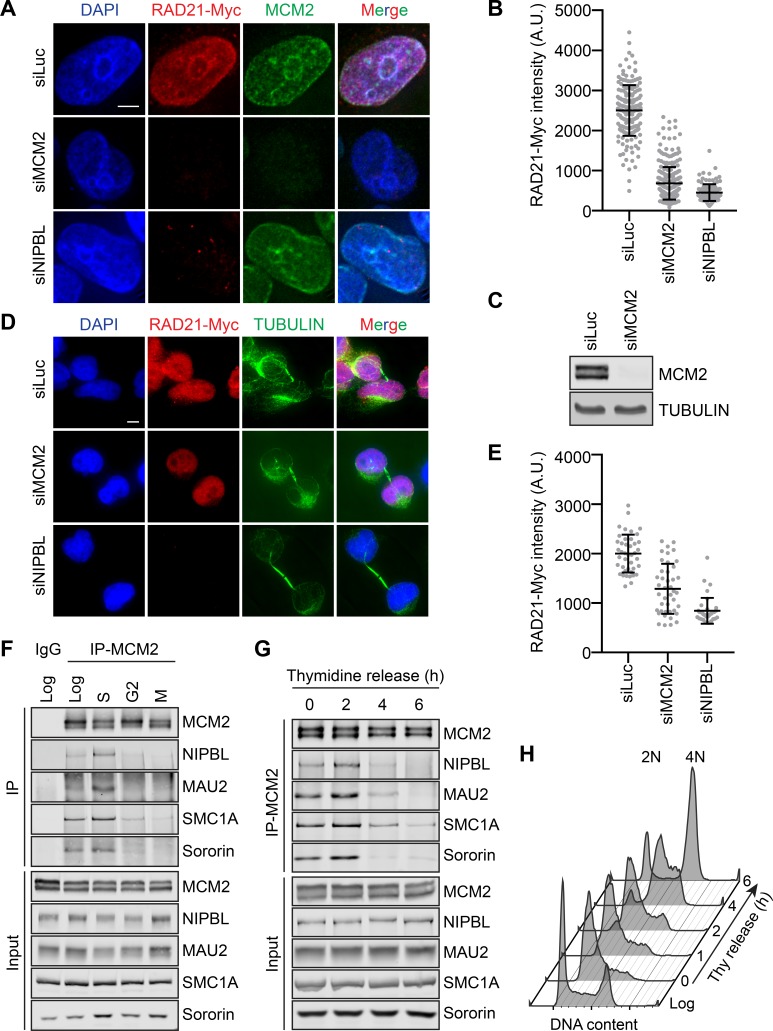
Figure 1. The MCM2–7 complex is required for cohesin loading during early S phase.
(A) DAPI (blue), anti-Myc (red), and anti-MCM2 (green) staining of HeLa cells that stably expressed RAD21-Myc. Cells were transfected with the indicated siRNAs and arrested in early S phase with thymidine before fixation and staining. Scale bar, 5 μm. (B) Quantification of the chromatin intensities of RAD21-Myc of cells in (A). Each dot in the graph represents a single cell. Mean ± SD (siLuc, n = 184; siMCM2, n = 295; siNIPBL, n = 115). (C) Lysates of HeLa cells either mock transfected or transfected with siMCM2 were blotted with the indicated antibodies. (D) DAPI (blue), anti-Myc (red), and anti-TUBULIN (green) staining of telophase HeLa cells that stably expressed RAD21-Myc. Cells were transfected with the indicated siRNAs and released from nocodazole-mediated mitotic arrest for 4 hr before fixation. Scale bar, 5 μm. (E) Quantification of the RAD21-Myc chromatin intensities of cells in (D). Each dot in the graph represents a single cell. Mean ± SD (siLuc, n = 42; siMCM2, n = 42; siNIPBL, n = 38). (F) Log-phase HeLa cells and cells synchronized in early S phase by thymidine, G2 by the CDK1 inhibitor, or mitosis by nocodazole were collected and lysed in the presence of nuclease. The total cell lysates (input) and anti-MCM2 immunoprecipitate (IP) were blotted with the indicated antibodies. IgG IP from log-phase cells was used as a negative control. (G) HeLa cells were synchronized with thymidine for 16–18 hr, released from thymidine, and harvested at the indicated time points. Cells were lysed in the presence of nuclease. The total cell lysates (input) and anti-MCM2 IP were blotted with the indicated antibodies. (H) Flow cytometry analysis of log-phase HeLa cells and cells released from the thymidine arrest for the indicated times.


