. 2018 Apr 3;7:e33920. doi: 10.7554/eLife.33920

Figure 6. RPA promotes interphase sister-chromatid cohesion, cohesin loading in early S phase, and the MCM–NIPBL–cohesin interaction.

(A) Representative images of G2-enriched HeLa cells transfected with the indicated siRNAs and stained with DAPI (blue in merge) and the early-replicating 466L19 FISH probe (red in merge). Selected paired FISH signals are magnified in inset. Scale bar, 5 μm. (B) Quantification of the distances between paired FISH signals of cells in (A). Mean ± SD (siLuc, n = 439; siSororin, n = 226; siRPA2, n = 59). (C) Quantification of the distances between paired FISH signals in G2-enriched HeLa cells transfected with the indicated plasmids and siRNAs. Mean ± SD (Vector + siLuc, n = 14; Vector + siRPA2, n = 78; Myc-RPA2 +siRPA2, n = 34). (D) DAPI (blue) and anti-Myc (red) staining of HeLa cells that stably expressed RAD21-Myc. Cells were transfected with the indicated siRNAs and arrested in early S phase with thymidine before fixation and staining. Scale bar, 5 μm. (E) Quantification of the chromatin intensities of RAD21-Myc of cells in (D). Mean ± SD (siLuc, n = 215; siMCM2, n = 298; siCDC7, n = 75; siNIPBL, n = 91; siSTAG2, n = 52; siRPA2, n = 131). (F,G) HeLa cells were transfected with the indicated siRNAs, synchronized in early S phase by thymidine, and lysed in the presence of Turbo nuclease. The total lysates (input) and anti-MCM2 immunoprecipitate (IP) were blotted with the indicated antibodies. (H) Lysates of HeLa cells transfected with the indicated siRNAs and arrested at early S phase with thymidine were blotted with the indicated antibodies.

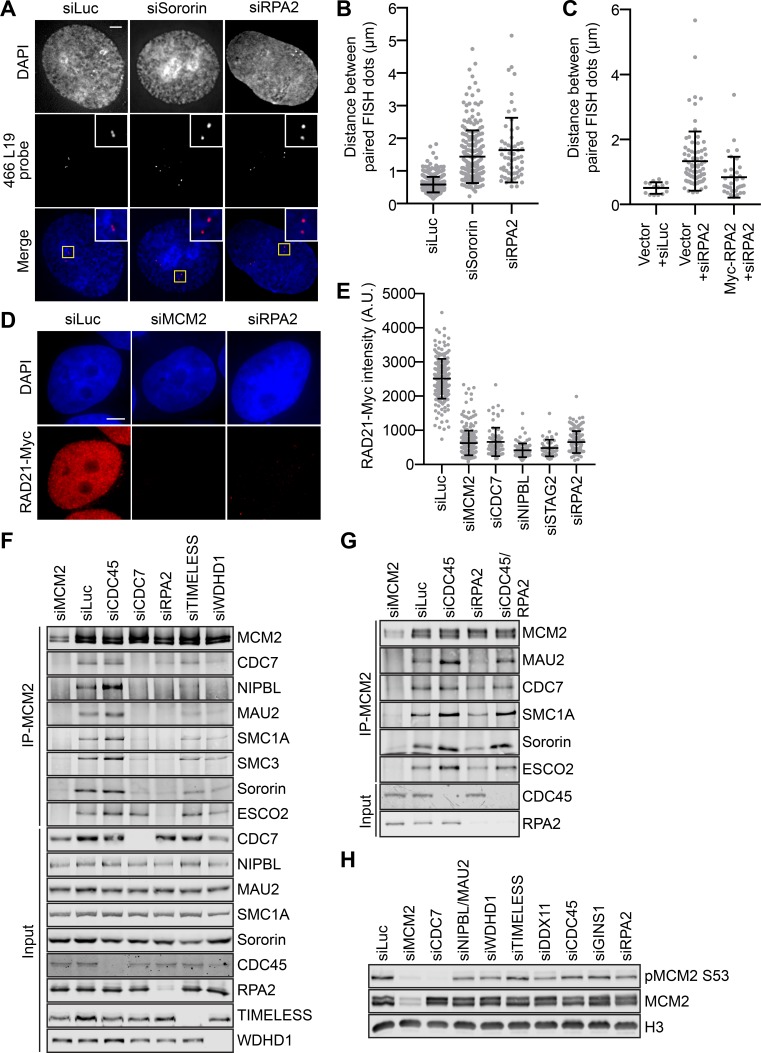
Figure 6.

Figure 6—figure supplement 1. RPA2 promotes sister-chromatid cohesion.

Figure 6—figure supplement 1.

Lysates of cells in Figure 6C were blotted with the indicated antibodies.
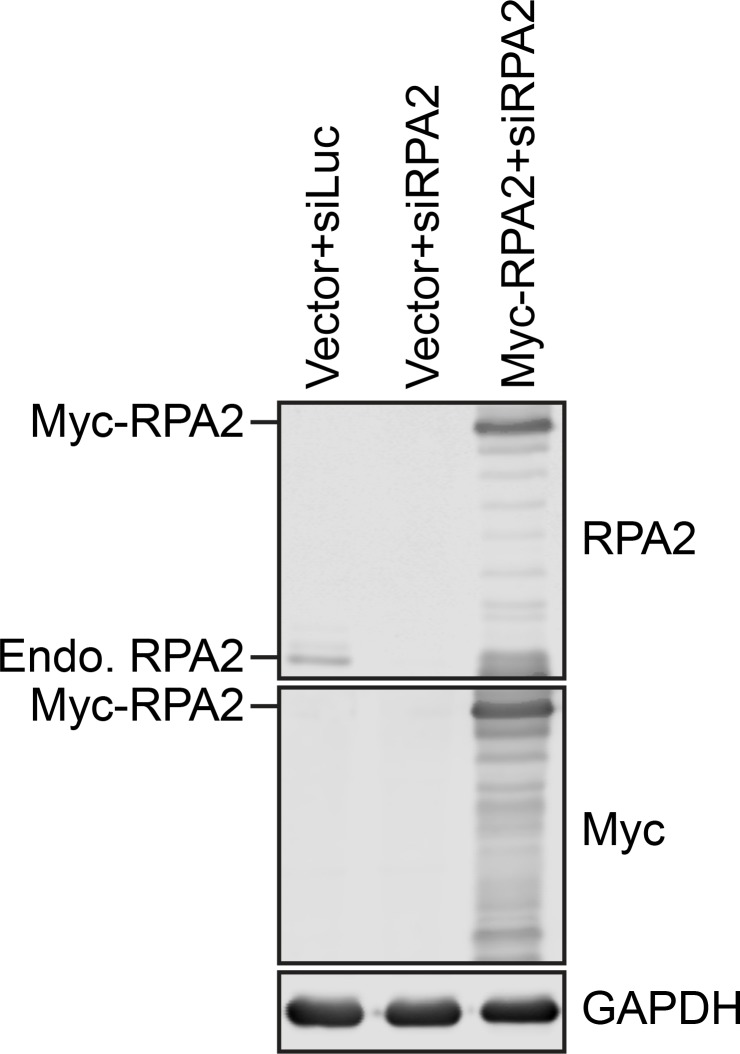
Figure 6—figure supplement 2. RPA2 promotes sister-chromatid cohesion.

Figure 6—figure supplement 2.

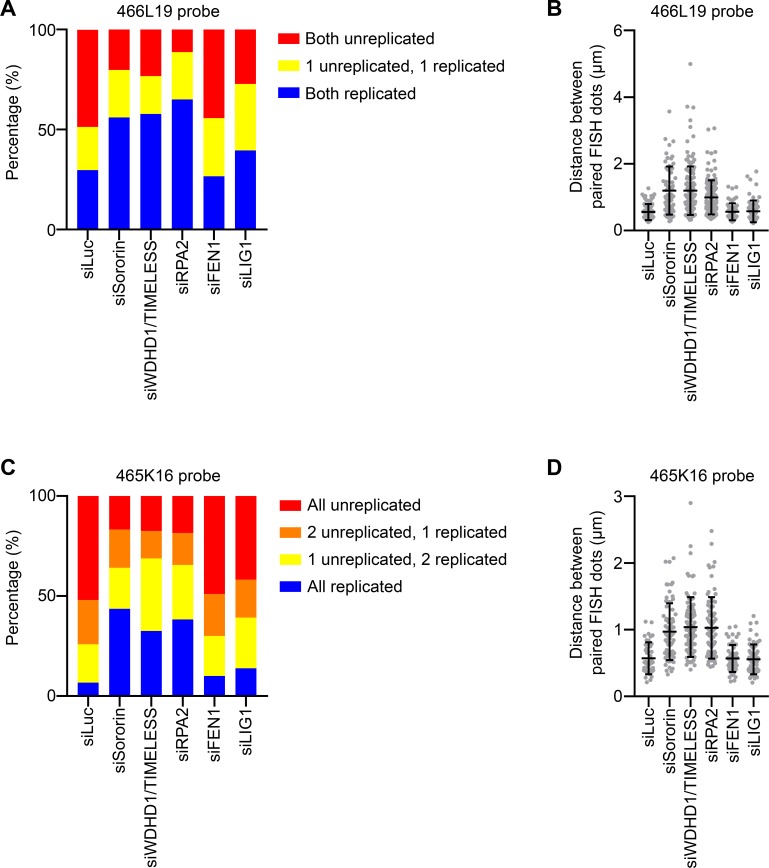
(A) Asynchronous cells or cells released from the thymidine arrest for the indicated times were harvested and stained with the 466L19 FISH probe. Quantification of the percentages of cells with two unreplicated single FISH dots (red), cells with one unreplicated FISH dot and one pair of replicated FISH dots (yellow), or cells with two pairs of replicated FISH dots (blue). (B) Asynchronous cells or cells released from the thymidine arrest for the indicated times were harvested and stained with the 465K16 FISH probe. Note that HeLa cells contains three copies of the chromosome locus recognized by this probe. Quantification of the percentages of cells with three unreplicated single FISH dots (red), cells with two unreplicated single FISH dots and one pair of replicated FISH dots (orange), cells with one unreplicated FISH dot and two pairs of replicated FISH dots (yellow), or cells with three pairs of replicated FISH dots (blue). (C) Representative images of G2-enriched HeLa cells transfected with the indicated siRNAs and stained with DAPI (blue in merge) and the 465K16 FISH probe (red in merge). Selected paired FISH signals are magnified and shown in inset. Scale bar, 5 μm. (D) Quantification of the distances between paired FISH signals of cells in C). Mean ±SD (siLuc, n = 65; siSororin, n = 70; siWDHD1/TIMELESS, n = 125; siRPA2, n = 116; siFEN1, n = 67; siLIG1, n = 97).
Figure 6—figure supplement 3. Depletion of RPA causes interphase cohesion defects in asynchronous cells.

Figure 6—figure supplement 3.

(A) HeLa cells were transfected with the indicated siRNAs and stained with the 466L19 FISH probe. The percentages of cells with two unreplicated single FISH dots (red), cells with one unreplicated FISH dot and one pair of replicated FISH dots (yellow), or cells with two pairs of replicated FISH dots (blue) were quantified and shown. (B) Quantification of the distances between paired FISH signals of cells transfected with the indicated siRNAs and stained with the 466L19 FISH probe. Mean ±SD (siLuc, n = 81; siSororin, n = 60; siWDHD1/TIMELESS, n = 140; siRPA2, n = 133; siFEN1, n = 63; siLIG1, n = 68). (C) HeLa cells were transfected with the indicated siRNAs and stained with the 465K16 FISH probe. Quantification of the percentages of cells with three unreplicated single FISH dots (red), cells with two unreplicated single FISH dots and one pair of replicated FISH dots (orange), cells with one unreplicated FISH dot and two pairs of replicated FISH dots (yellow), or cells with three pairs of replicated FISH dots (blue). (D) Quantification of the distances between paired FISH signals of cells transfected with the indicated siRNAs and stained with the 465K16 FISH probe. Mean ±SD (siLuc, n = 40; siSororin, n = 70; siWDHD1/TIMELESS, n = 83; siRPA2, n = 74; siFEN1, n = 59; siLIG1, n = 64).
Figure 6—figure supplement 4. RPA2 promotes cohesin loading in S phase.

Figure 6—figure supplement 4.

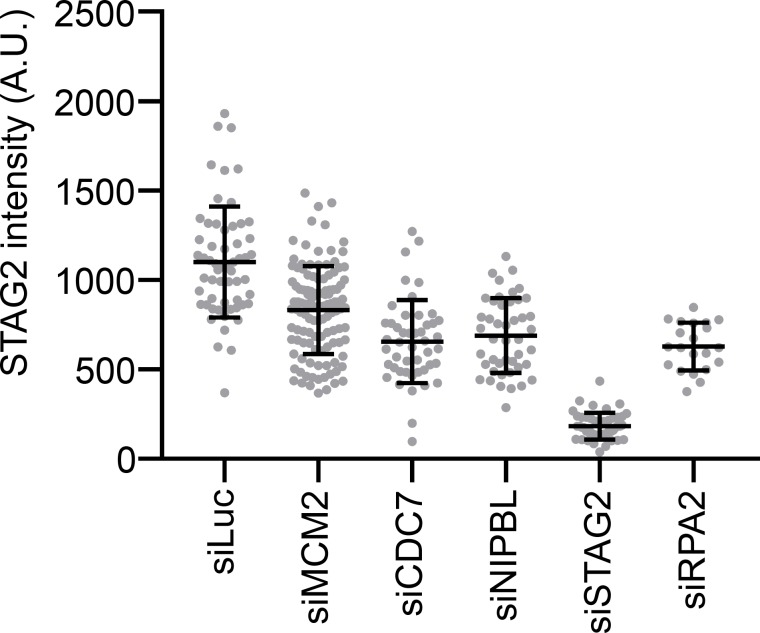
Quantification of the intensities of chromatin-bound STAG2 in HeLa cells transfected with the indicated siRNAs and synchronized in early S phase by thymidine. Each dot in the graph represents a single cell. Mean ±SD (siLuc, n = 58; siMCM2, n = 117; siCDC7, n = 47; siNIPBL, n = 45; siSTAG2, n = 48; siRPA2, n = 21).