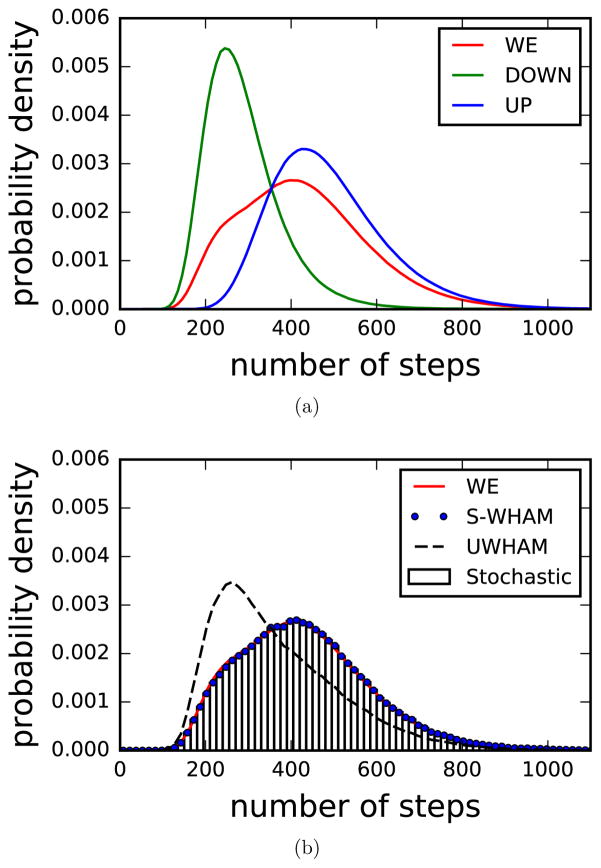
Figure 8.
probability densities of transition-event durations at the λ = 0.0 state. (a) the probability density of transition-event durations at the λ = 0.0 state obtained by WE simulations. The blue line is the probability density of transition-event durations of the paths in the UP channel; the green line is the probability density of transition-event durations of the paths in the DOWN channel; and the red line is the overall probability density of transition-event durations at the λ = 0.0 state. (b) Comparison of the probability density of transition-event durations at the λ = 0.0 state estimated by Stratified-UWHAM, Stratified RE-SWHAM and the benchmark when the population ratio nD/(nD + nU) is 80%. The blue dots are the Stratified-UWHAM estimates; the bars are the Stratified RE-SWHAM estimates and the dash line is the conventional UWHAM estimates. The conventional UWHAM estimates show a significant difference compared with the benchmark, while Stratified-UWHAM and Stratified RE-SWHAM estimates agree with the benchmark very well.

