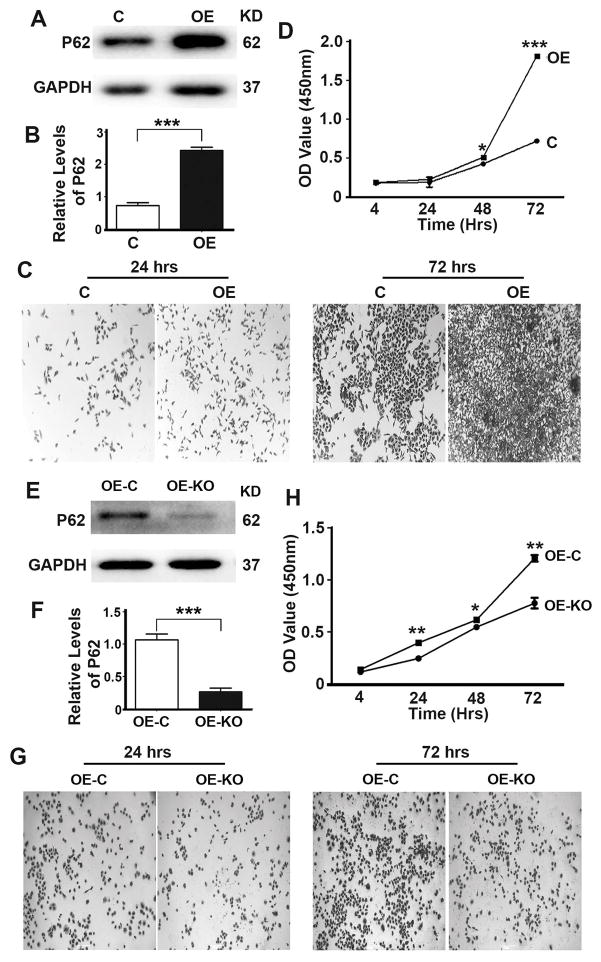
Figure 1. P62 promotes proliferation of prostate cancer cells.
(A,B) Representative immunoblot (A) and quantification (B) showing levels of P62 in DU145 cells (Control, C) and DU145 cells stably expressing P62 (overexpression, OE). C cells were stable DU145 cells carrying the control plasmid vector. (C,D) Representative images (C) and quantification (D) showing cell densities of DU145 cells (C and OE) at 24 and 72 hrs after seeding. (E,F) Representative immunoblot (E) and quantification (F) showing levels of P62 in DU145 cells stably expressing P62 (Control, OE-C) and DU145 cells stably expressing P62 with P62 depleted by through CRISPR/Cas9 (OE-KO). OE-C cells were stable DU145 cells expressing P62 carrying the control plasmid vector. (G,H) Representative images (G) and quantification (H) showing cell densities of DU145 cells (OE-C and OE-KO) at 24 and 72 hrs after seeding. Tissue culture plates were seeded with equal number of cells. *, p ≤ 0.05; **, p ≤ 0.01; and ***, p ≤ 0.001.

