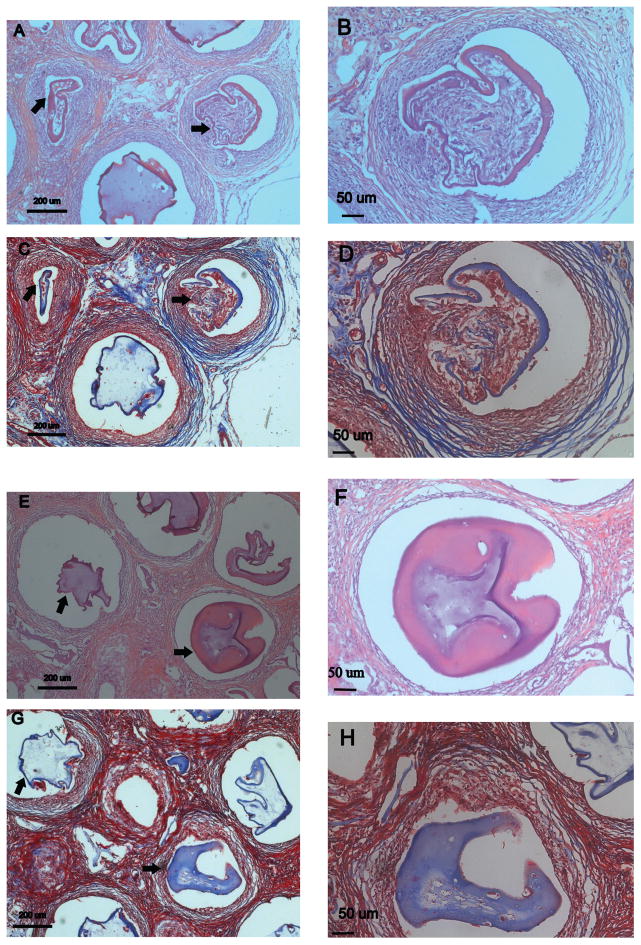
FIGURE 3.
H&E and Masson’s Trichrome images of stable and failed alginate microbeads. Failed beads (A–D) exhibit characteristics of a chronic inflammatory response indicated by a high cell density (B). The thickness of the inflammatory tissue surrounding failed alginate microbeads was greater than stable microbeads. Stable beads (E–H) show a lower number of cells surrounding the alginate microbeads (F). Masson’s Trichrome indicates a high inflammation response in both failed and stable beads (C, D, G, H). Arrows indicate failed and stable beads.

