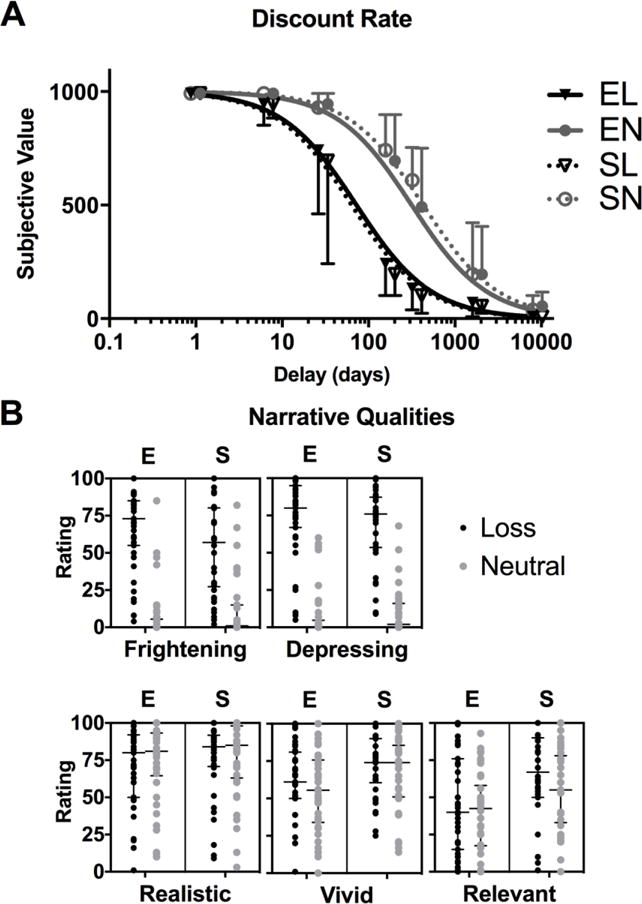
Figure 1. Effects of Narratives.

Figure 1 depicts responses to narrative manipulations. Panel A shows the discount rate across four groups: experimenter-provided job loss and negative income shock (EL), experimenter-provided neutral (EN), self-generated job loss and ensuing negative income shock (SL), and self-generated neutral (SN). The X axis depicts delay to reward receipt in days, and the Y depicts subjective value of receipt of a $1000 reward at each delay. Points reflect jittered median points of indifference between immediate and delayed reward receipt within groups, and error bars indicate interquartile range. Panel B shows individual subject ratings of narrative qualities. In all graphs, the left panel (“E”) indicates experimenter-provided narratives, and the right panel (“S”) indicates self-generated narratives. Participants rating of each narrative quality on a visual analogue scale (0-100) is indicated on the Y axis. Bars indicate median ratings within groups, and error bars indicate interquartile range. *p<0.05
