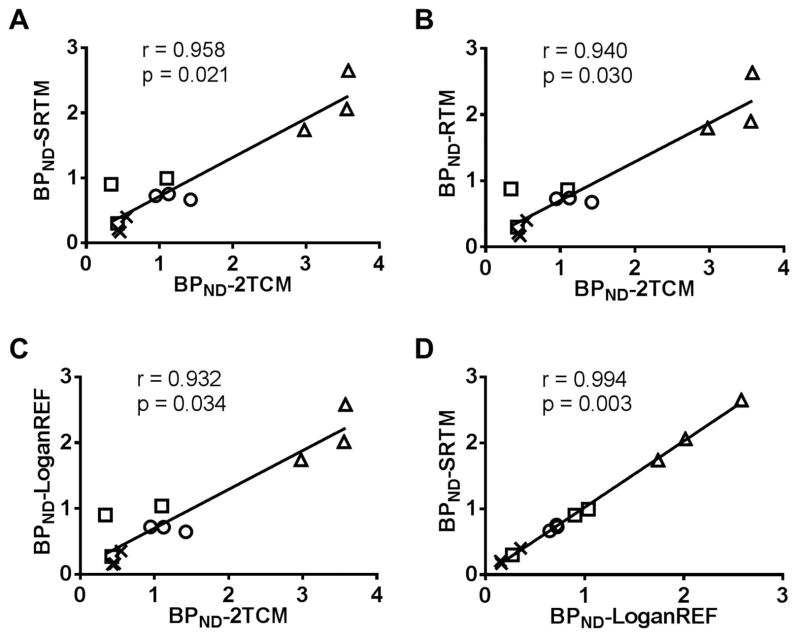
Figure 4. Scatter plot correlation between modeling methods.
A. Scatter plot of all brain regions BPND from SRTM versus 2TCM suggested that SRTM has strong positive correlation to 2TCM (r = 0.958, p = 0.021). B. RTM versus 2TCM suggested that RTM has positive correlation to 2TCM (r = 0.940, p = 0.030), but less than SRTM versus 2TCM. C. LoganREF also has a strong positive correlation to the 2TCM modeling (r = 0.932, p = 0.034). D. There was a high positive correlation between SRTM and LoganREF (r = 0.994, p = 0.003). △: striatum; ○: thalamus; □: hippocampus; x: frontal cortex.

