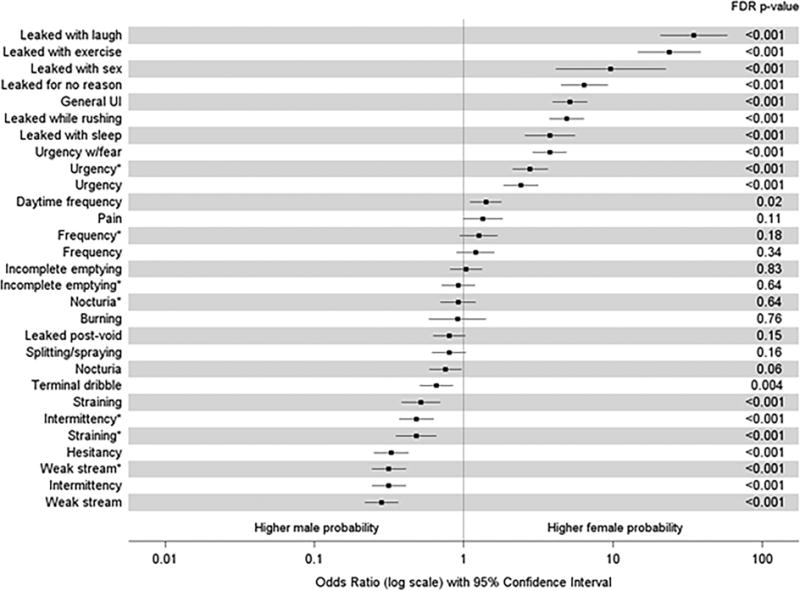
Figure 2. ORs (female vs. male) of LUTS symptoms by sex (adjusted for age).

Results from bivariate logistic regression models, with squares denoting ORs comparing female with male participants on the log-odds scale for each item on the LUTS Tool and AUA (AUA items denoted by *). Lines extend to the lower and upper 95% CIs. P-values listed on the right were adjusted for multiple comparisons using the false discovery rate method.
