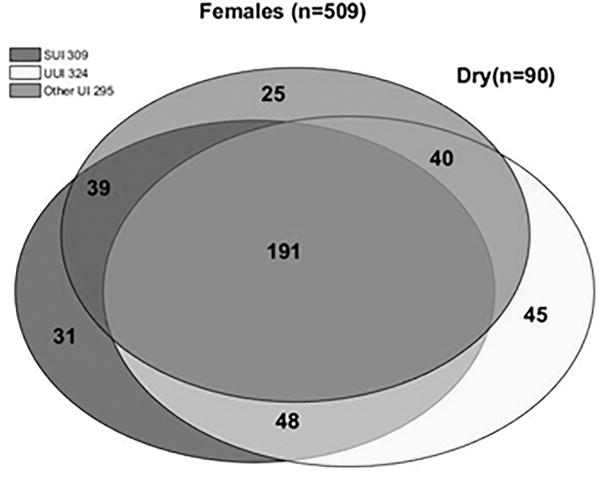
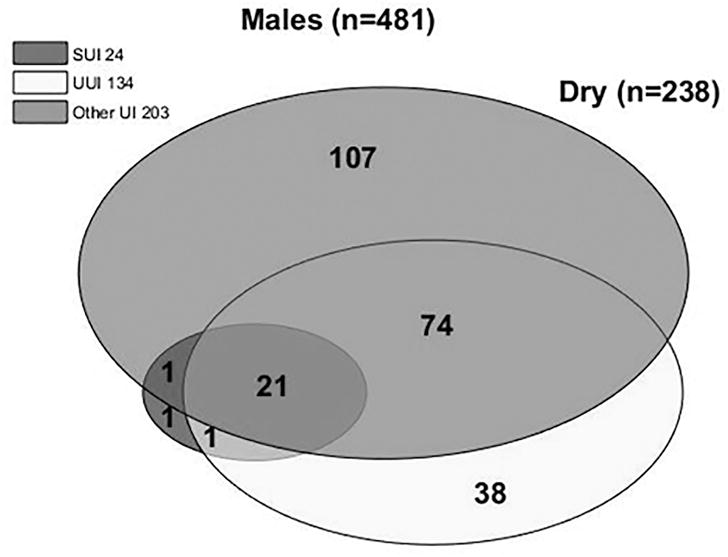
Figure 4. Venn diagram of incontinence subtypes based on LUTS tool responses.


Each circle represents the total number of participants with a given type of incontinence. Circle areas are proportional to the number of participants with a given type of incontinence relative to the total number of participants with incontinence. Each overlapping section represents the number of people with multiple (2 or 3) types of incontinence. A) Females; B) Males.
