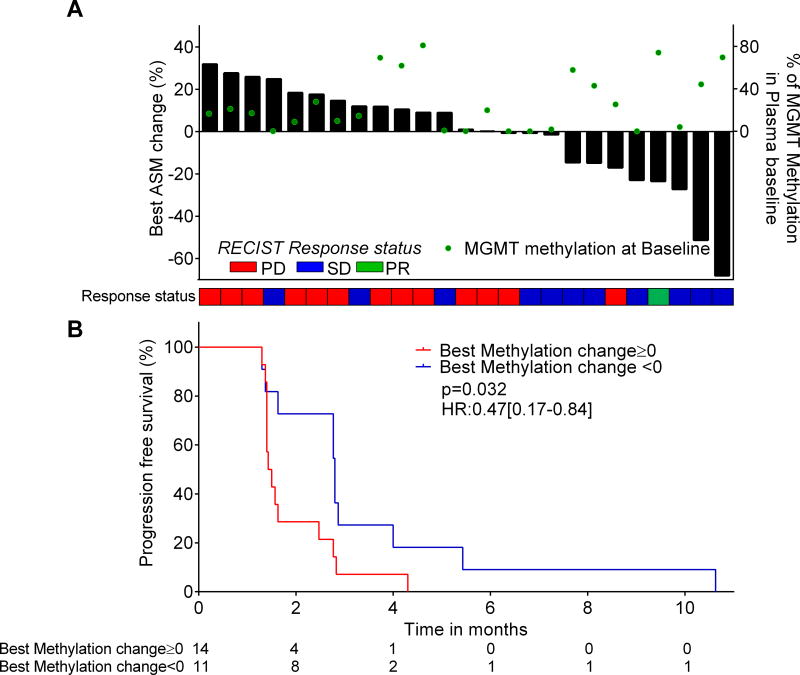
Figure 5. Average of selected markers (ASM) incfDNA dynamics assessment in mCRC patients treated with temozolomide within a clinical trial.
A: Comparison of ASM changes to response status and RECIST. The best ASM changes were plotted as a waterfall plot. Response status of patients evaluated by RECIST is plotted as a heatmap. B: Progression free survival according to best ASM change. Negative ASM change shows a trend for improved PFS.

