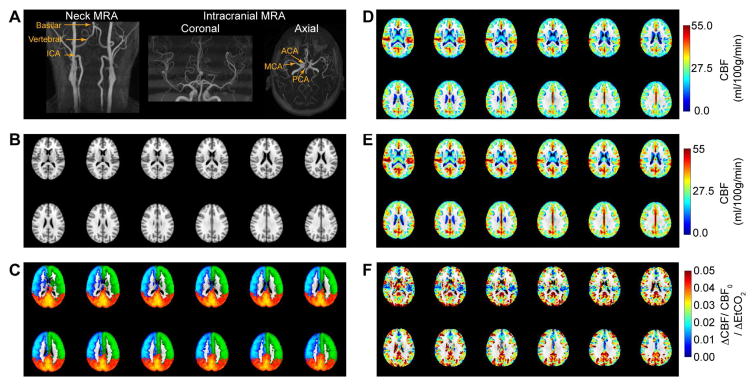
Figure 1.
Healthy cerebral blood flow (CBF) and cerebrovascular reactivity (CVR) patterns. (A) Major neck and head vessels as visualized from 3.0 Tesla time-of-flight magnetic resonance angiography. (B) Tissue atlas (Montreal Neurological Institute; 2 mm isotropic) and (C) corresponding flow territories averaged from healthy adults overlaid on the atlas, as quantified from vessel-encoded arterial spin labeling MRI (red=basilar artery; green=left ICA; blue= right ICA). (D) Normocapnic normoxic CBF, (E) Hypercapnic (5% CO2) normoxic CBF, and corresponding (F) CVR quantified as the fractional CBF change normalized by the end-tidal change in CO2 (EtCO2) in 10 healthy subjects. CBF was determined using arterial spin labeling and thresholded to show gray matter only, as white matter CBF values are less reliable using ASL at 3.0T. Additional information can be found in (Donahue et al., 2014b)

