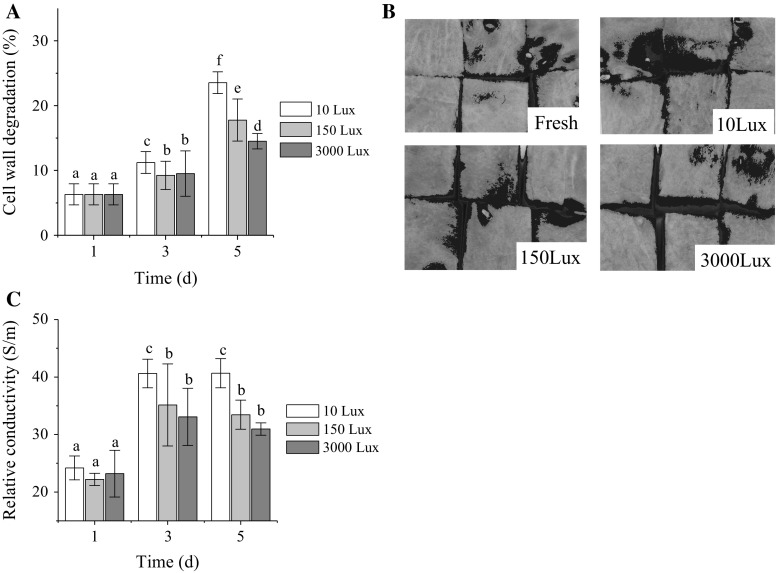
Fig. 2.
Effect of visible light exposure on cell wall degradation ratio (a), appearance (b), and relative conductivity (c) of fresh-cut watermelon in the fifth day. The blue region represents the degradation of cells. Data are mean ± SD (n ≥ 6). Means with a different letter represent a significant difference (p < 0.05)

