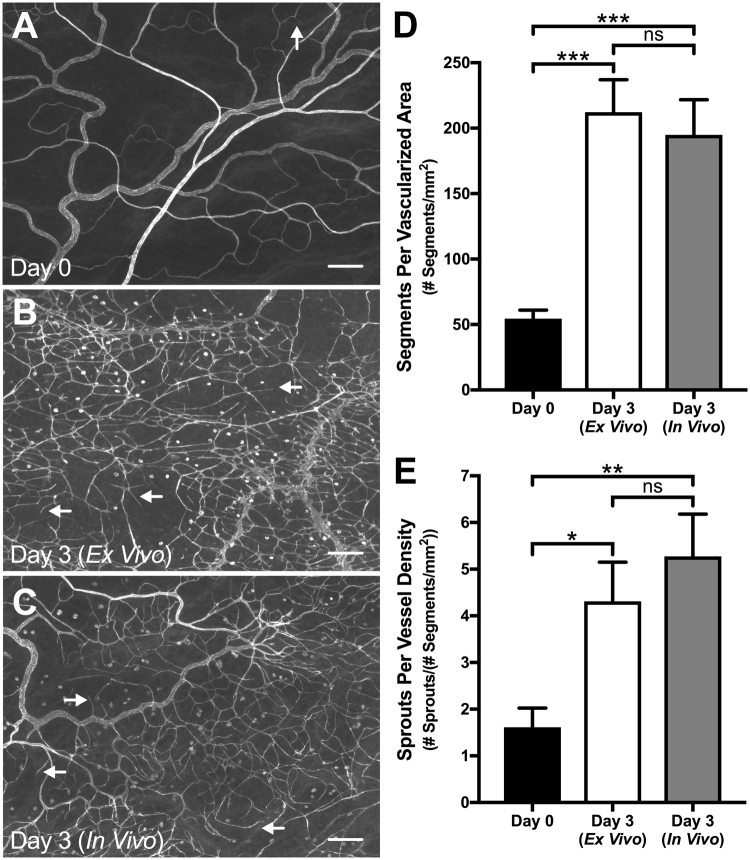
Figure 1.
Angiogenesis in ex vivo cultured microvascular networks is similar to angiogenic in vivo microvasculature. (A–C) Comparison between Day 0 (A) and both Day 3 (Ex Vivo) (B) and Day 3 (In Vivo) (C) groups revealed an increase in capillary sprouting and vessel density. Microvascular networks were visualized with PECAM labeling. Arrows identify examples of capillary sprouts. Scale bars = 200 µm. (D,E) Vessel density and capillary sprouting were quantified from Day 0 tissues and both Day 3 (Ex Vivo) and Day 3 (In Vivo) angiogenic tissues. Black, white, and grey bars represent Day 0, Day 3 (Ex Vivo), and Day 3 (In Vivo) groups respectively. The *, **, and *** indicate a significant difference of p < 0.05, p < 0.01, and p < 0.001, respectively by One-Way ANOVA and Holm-Sidak post hoc method. “ns” indicates no significant difference (p > 0.05).

