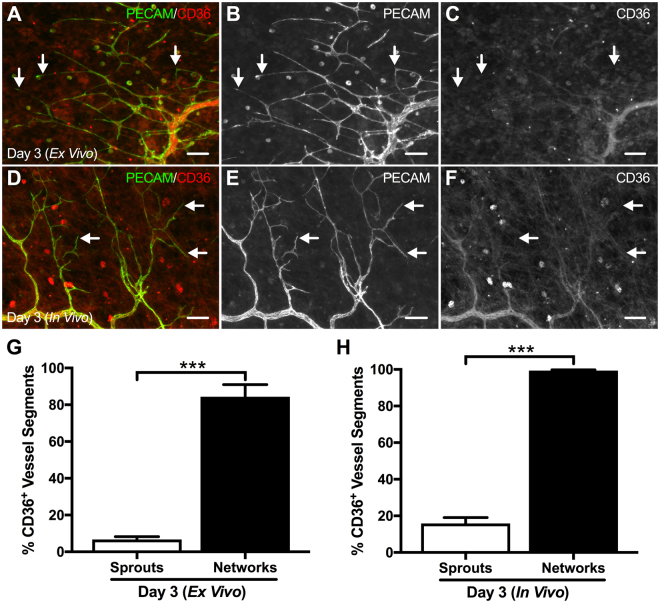
Figure 5.
Illustration of CD36 labeling in ex vivo cultured microvascular networks and stimulated in vivo microvasculature. Comparison between Day 3 (Ex Vivo) (A–C) and Day 3 (In Vivo) (D–F) microvascular networks revealed diminishing CD36 labeling along the length of the capillary sprout becoming absent at the tip. Arrows identify examples of CD36-negative capillary sprouts. Scale bars = 200 µm. (G,H) Capillary sprouts exhibited a substantial decrease in CD36 labeling compared to larger network vessels ( > 10 µm) in Day 3 (Ex Vivo) and Day 3 (In Vivo) tissues. White and black bars represent “Sprouts” and “Networks” respectively for Day 3 (Ex Vivo) and Day 3 (In Vivo) groups. The *** indicates a significant difference of p < 0.001 by Mann-Whitney U test.

