Figure 4.
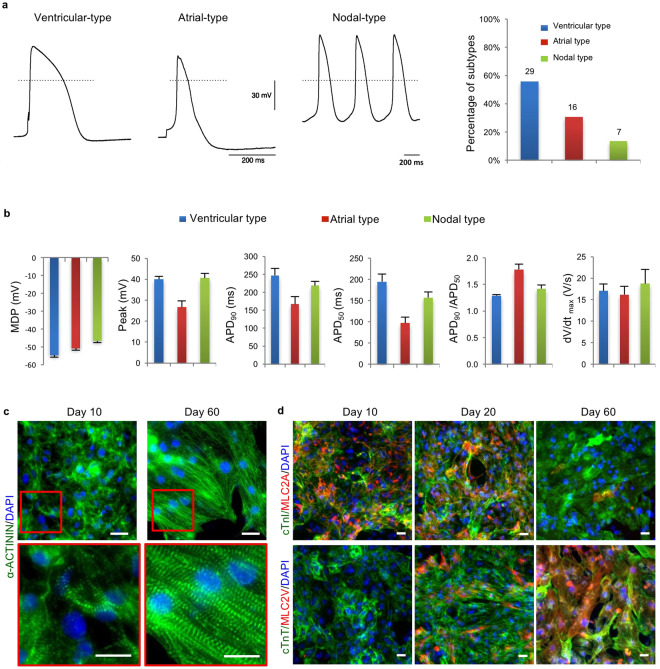
Further characterization of RhiPSC-CMs. (a) Representative action potentials from patch clamp recordings of the three cardiomyocyte substypes (ventricular, n = 29; atrial, n = 16; and nodal, n = 7) at day 20 of differentiation. (b) Patch clamp recording of MDP, peak voltage, APD at different levels of repolarization (90% and 50%), and dV/dtmax rate from three cardiomyocyte subtypes (ventricular, n = 26; atrial, n = 19; and nodal, n = 7) at day 15–20 of differentiation. (c) Representative immunofluorescence staining for α-ACTININ from more than 3 experiments showed increased sarcomere alignment in RhiPSC-CMs from 10 days to 60 days of culture. The details within red rectangle boxes in upper panels are shown in the lower panels. Nuclei were stained by DAPI. Scale bars, 25 µm. (d) Co-staining for MLC2A and MLC2V with cTnI or cTnT showed that most cells expressed MLC2A at early stage (10 days) but expressed MLC2V at late stage (60 days), while a mix population of MLC2A and MLC2V expressing cells was observed at day 20. Nuclei were stained by DAPI. Scale bars, 25 µm.

