Figure 3.
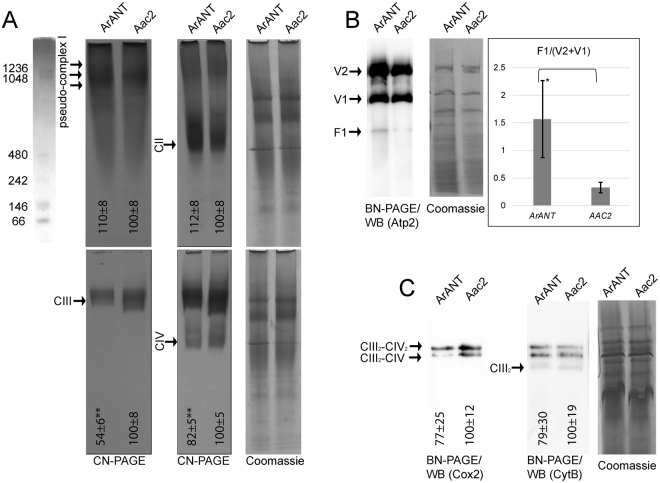
(A) In-gel enzymatic activities of mitochondrial respiratory chain complexes. Solubilized mitochondrial complexes (400 µg) were separated by clear-native polyacrylamide gel electrophoresis (CN-PAGE). Gels were stained with Coomassie blue to visualize the protein complexes, or incubated with appropriate reagents (see Materials and Methods) to visualize the activities of NADH dehydrogenases Nde1, Nde2 and Ndi1 (collectively referred to as pseudo-complex I), succinate dehydrogenase (CII), cytochrome c reductase (CIII) and cytochrome c oxidase (CIV). Activity products were imaged using a standard flatbed scanner. The gel-lane scan on the top-most left corner is a molecular weight ladder (NativeMark™ Unstained Protein Standard, Thermofisher Sci, imaged at a different contrast and saturation level), to which all gel scans shown in panel A can be compared to. Gel scan corresponding to pseudo-complex I was taken after 1 hour of exposure; a time-lapse of exposures (also for complex II) is shown in Supplementary Figure 1). (B) Blue native-PAGE followed by Western blot analysis of FO-F1 ATP synthase in dimers (V2), monomers (V1), and free catalytic head form (F1). (C) BN-PAGE analysis followed by Western blotting of complexes III and IV. The complexes were detected by using antibodies against CytB (for complex III) and Cox2 (for CIV)). For loading controls, gels shown in A, B and C were stained with Coomassie (three replicates); a representative gel is depicted on the right of each panel. Densitometric analysis of the gel bands shown in panels (A and C) are arbitrarily normalized to the signals obtained from Aac2 samples. Densitometric analysis of the gel bands shown in the rightmost panel (B) is represented as the ratio of free F1/(dimers + monomers). Data shown are Mean +/− S.E.M. (n = 5). For panel (C), the Densitometric analysis included all bands. CIII2-CIV2 implies supramolecular forms of two complex III and two complex IV entities; CIII2-CIV implies supramolecular forms of two complex III and one complex IV entity, while CIII2 implies supramolecular forms of two complex III entities. Images are representative of scanned gels from three to five independent experiments. *p < 0.05, and **p < 0.001.

