Fig. 1.
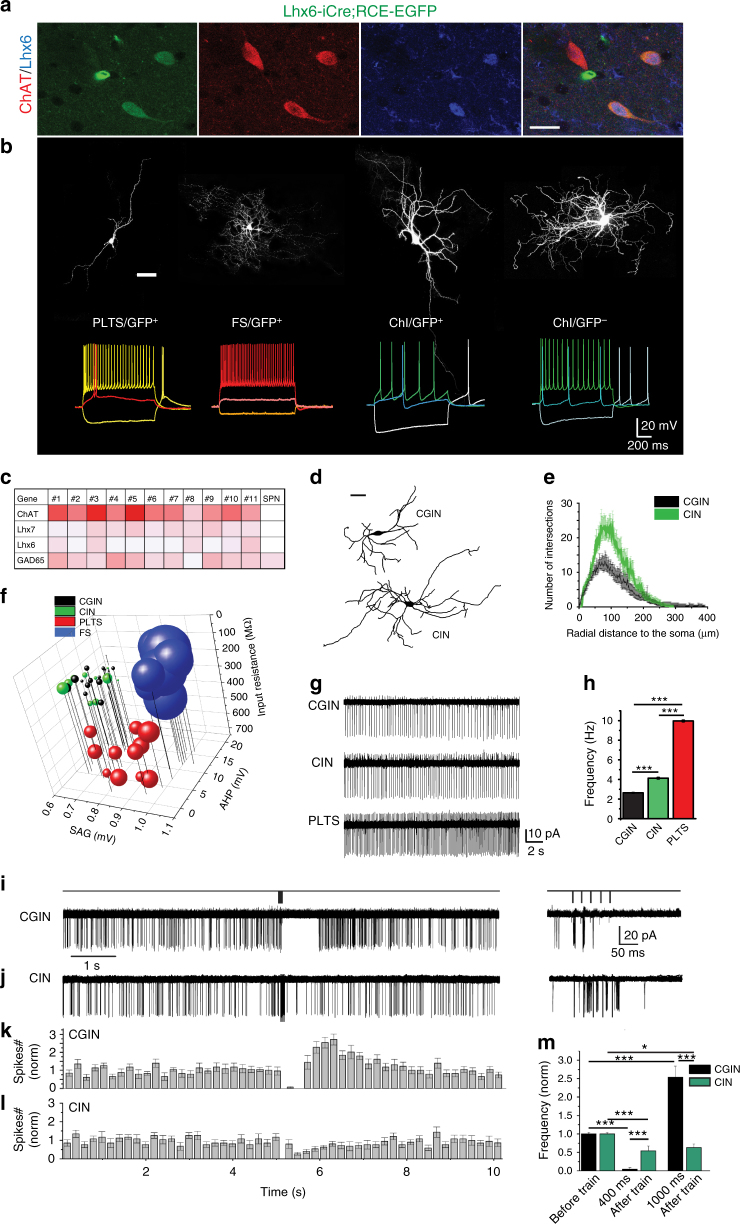
A subpopulation of cholinergic interneurons, CGINs, expresses cholinergic and GABAergic markers. a ChAT (red) and Lhx6 (blue) co-immunolabeling in EGFP+ (green) cells in Lhx6-iCre;RCE-EGFP mice. b Top: Representative images of biocytin-filled PLTS, FS, EGFP+, and EGFP− cholinergic interneurons (ChI) and (bottom) corresponding traces of their representative firing patterns. c RT-qPCR heat-map expression for ChAT, Lhx7, Lhx6, and GAD65 mRNAs in single cells (relative to HPRT mRNA; white to red: lowest to highest expression, SPN: negative control). d Representative reconstructed CIN and CGIN dendritic trees. e Sholl analysis of CGINs and CINs dendrites. f Distinct cluster formed by CGIN and CIN from PLTS and FS interneurons (3D plot of intrinsic properties). g Representative traces of cell-attached spontaneous spiking of CGIN, CIN, and PLTS interneuron. h Corresponding mean firing frequencies. i, j Top: Stimulation protocol; left: representative several superimposed consecutive i CGINs or j CINs responses to cortical train stimulation in cell-attached mode; right: responses within the train at extended time scale. Mean frequency histograms for k CGINs and l CINs. m Mean number of spikes during time windows after train stimulation (0–400 ms, 800–1000 ms) normalized to spikes counts before train. Scale bars: a 20 µm; b, d 50 µm. All means ± SEM. e Data sets were analyzed using Kolmogorov-Smirnov test; see Supplementary Table 1 for statistics. h, m Data sets were analyzed using one-way ANOVA followed by Fisher’s least significant difference (LSD) post-hoc test; see Supplementary Table 2 for statistics; *P < 0.05, ***P < 0.001

