Fig. 1.
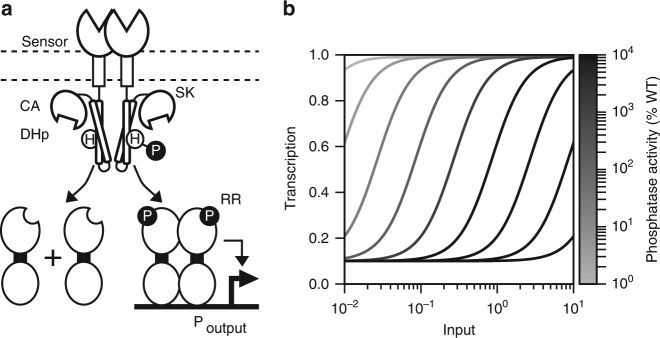
Mathematical model reveals that SK phosphatase activity tunes TCS detection threshold. a Diagram of a canonical TCS. b Model simulations of the relationship between TCS input concentration and transcriptional output rate (i.e., transfer function) wherein SK phosphatase activity is varied between 1% and 10,000% of wild-type (Supplementary Note 1). Detection threshold (K1/2), or the input concentration where transcriptional output is half-maximal, increases with phosphatase activity. There is no trade-off between detection threshold and dynamic range for intermediate changes in phosphatase activity; however, a trade-off emerges for strong changes in phosphatase activity (Supplementary Fig. 1)

