Fig. 1.
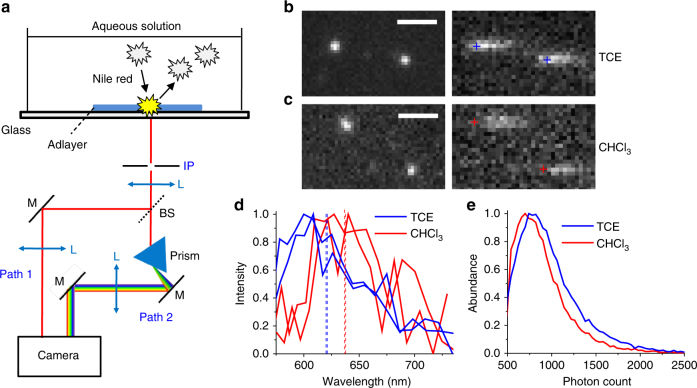
Spectrally resolved super-resolution microscopy of small-molecule adlayers. a Experimental setup. The stochastic insertion of individual Nile red molecules from an aqueous solution into the TIR-illuminated adlayers leads to bursts of single-molecule fluorescence, which is split into two light paths for concurrent recording of the position (Path 1) and the spectrum (Path 2) of each molecule in the wide field. IP: intermediate image plane, L: lens, BS: beam splitter, M: mirror. b A small region of the concurrently acquired images (left) and spectra (right) of two single Nile red molecules inserted into TCE adlayers, obtained in a 9-ms snapshot. Crosses indicate the mapped spectral positions of 590 nm for each molecule. Scale bar is 2 μm. c Results of chloroform adlayers. Scale bar is 2 μm. d Spectra of the four single molecules in b, c. Dash lines give the spectral mean of each spectrum. e Distribution of photon counts in the image channel for single Nile red molecules in typical data of TCE (blue; average is 984 photons) and chloroform (red; average is 896 photons) adlayers

