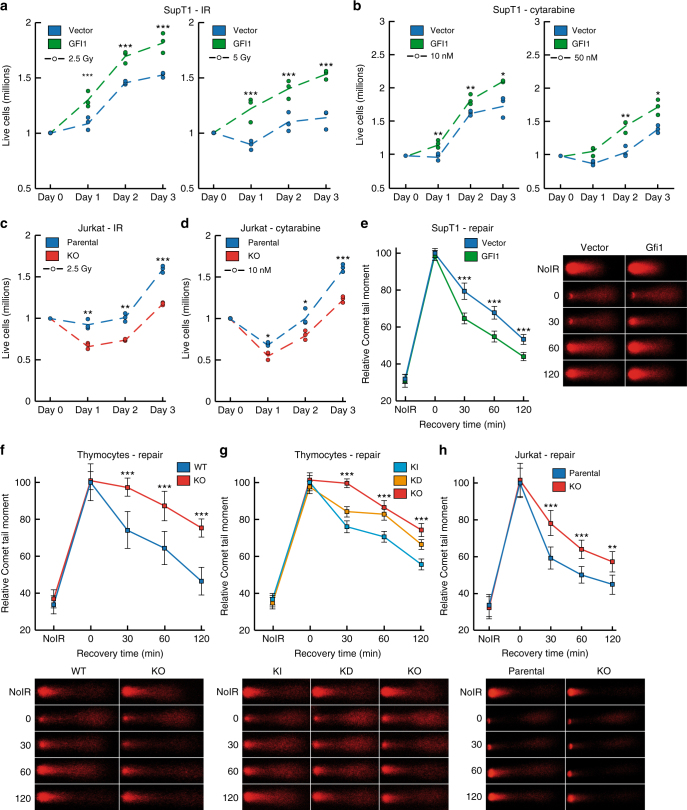
Fig. 1.
GFI1 promotes survival and repair of DNA damage. a GFI1 overexpressing SupT1 cells and vector control cells were seeded at 1 million cells per ml and exposed to 2.5 (left panel) or 5 (right panel) Gy IR. Cells were counted each following day. Dashed lines show average cell numbers and individual data points of a triplicate experiment are shown. *p < 0.05, **p < 0.01, ***p < 0.001 on a Welch corrected T-test. b SupT1 cells as in A were exposed to 10 (left panel) or 50 (right panel) nM Cytarabine. Cells were counted and results are presented as in a. c Gfi1 KO Jurkat T cells and parental control cells were seeded at 1 million cells per ml and exposed to 2.5 Gy IR. Cells were counted and results are presented as in a. d Jurkat cells as in c were exposed to 10 nM Cytarabine. Cells were counted and results are presented as in a. e GFI1 overexpressing SupT1 cells and vector controls were exposed to 5 Gy and allowed to recover for the indicated time. Cells were then lysed and analyzed by alkaline Comet assay. Comet tail moment averages are shown with representative images on the right. One of three replicate experiments is shown. Error bars represent s.d. f Thymocytes extracted from Gfi1 WT and age and sex matched Gfi1 KO mice were treated and analyzed as in e. Representative images are shown below the graph. g Thymocytes from Gfi1 KI, KD and KO mice were treated and analyzed as in e. h Jurkat cells with GFI1 KO and parental control cells were treated and analyzed as in e

