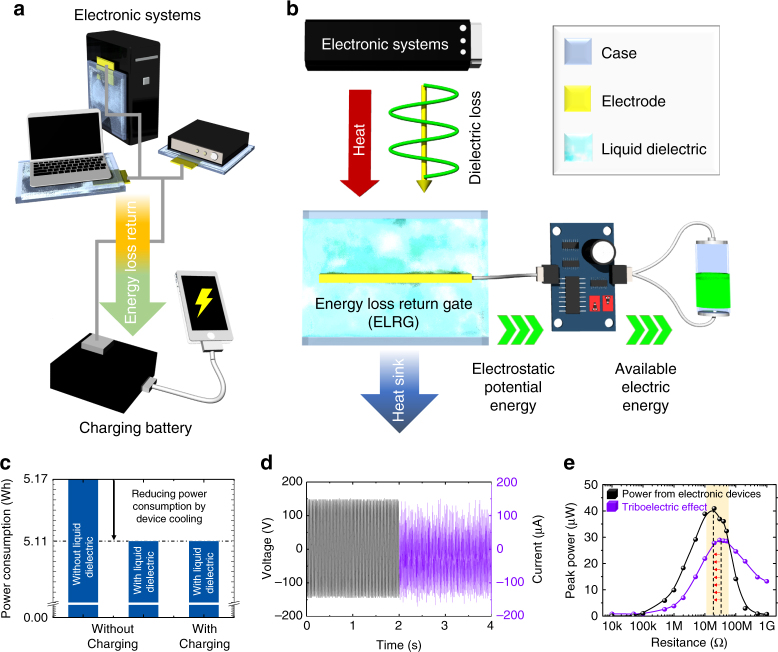
Fig. 5.
Operation schemes and electric performances from ELRG process. Electric device is plugged into a 60-Hz AC input electrical source. a Configuration of ELRG for practical application. b Operation scheme of ELRG with electric components. c Power consumption measurements from wattmeter. Without liquid dielectric/without charging (left); with liquid dielectric/without charging (middle); with liquid dielectric/with charging (right). Dotted black line represents no difference. d ELRG outputs from the electric device. Open-circuit voltage (left plot); short-circuit current (right plot). e Peak power plots under load resistances. Measurements show the inherent impedance of ELRG and TEG. The difference is highlighted by dashed black lines and red arrows

