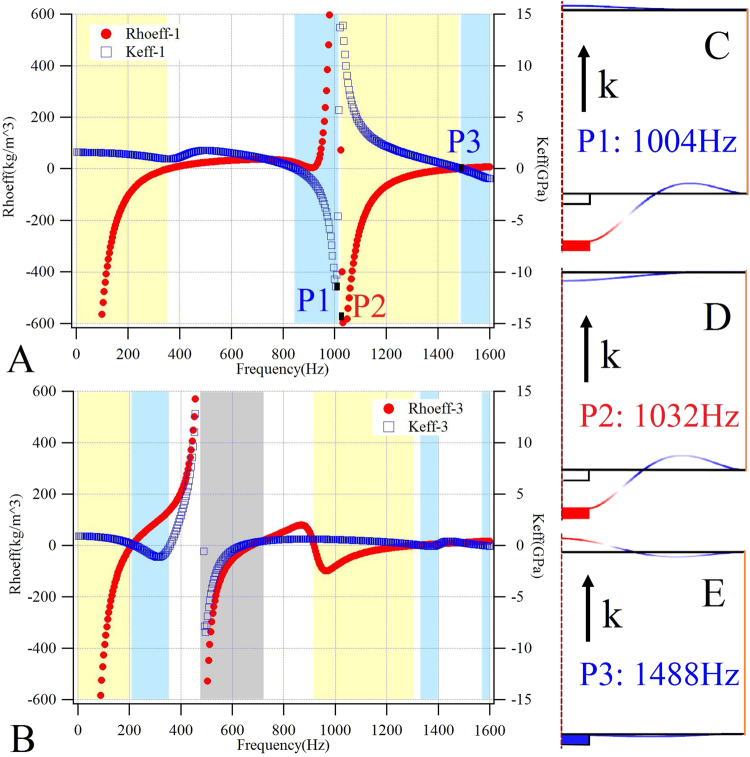
Figure 3.
The effective parameters and vibration displacement contours. The calculated (red curves) and (blue curves) of the model-1 (A) and model-3 (B), wherein the yellow (cyan) shaded areas represent the negative () bands, the gray shaded area represents the double negative band, and the damping ratio is reduced to 1%. The vibration displacement contours at point-P1 (C), point-P2 (D), and point-P3 (E). In (C) to (E), with red/blue representing the maximum/minimum displacement respectively, black arrows the sound incident direction, and the black frames the equilibrium position of plates and masses.

