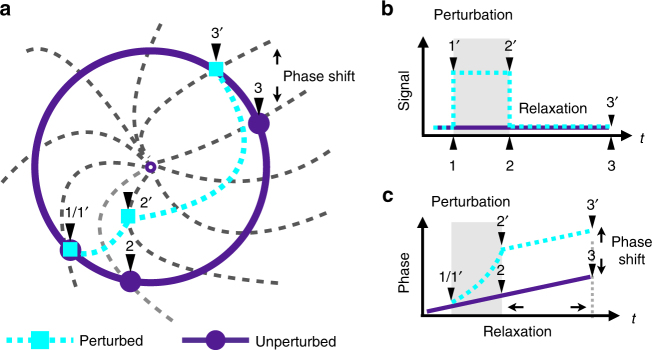
Fig. 1.
Illustration of the phase response in biological oscillators. a The circle is the assumed stable limit cycle. The gray dashed lines represent equally separated isochrons. An unperturbed system (purple) progresses on the circle, while a perturbed system (cyan) is driven away from the circle by an impulsive signal between time 1 and time 2, and then relaxes back to the limit cycle. At time 2 (end of perturbation), it is moved to an isochron different from the unperturbed one. The difference of their phases determines the phase shift. b, c Diagrams of the signal and phase evolution of the perturbed and unperturbed system. Phase shift is induced during the perturbation and sustains after the perturbation

