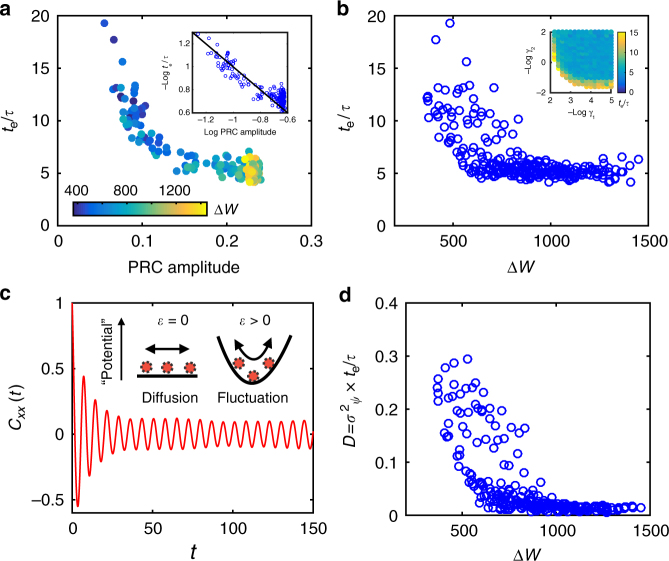
Fig. 4.
Relation between entrainment performance and phase sensitivity and free-energy dissipation. a The minimum number of cycles needed for entrainment te/τ versus the PRC amplitude for different choices of (γ1, γ2). The energy dissipation per period ΔW is shown by the color of the data points. The log-log plot in the inset clearly shows te/τ scales inversely with the PRC amplitude. b te/τ decreases with ΔW. The inset shows te/τ (represented by the color) in the space. c Autocorrelation function Cxx(t) versus time t. The amplitude first decays exponentially and then reaches a constant in agreement with Eq. (10). The phase dynamics in the cases without ( = 0) and with ( > 0) external driving signal are illustrated in the inset. d The phase diffusion constant D, inferred from phase variance, decreases with the energy dissipation ΔW. The external driving signal strength = 0.1 for all simulations

