Fig. 6.
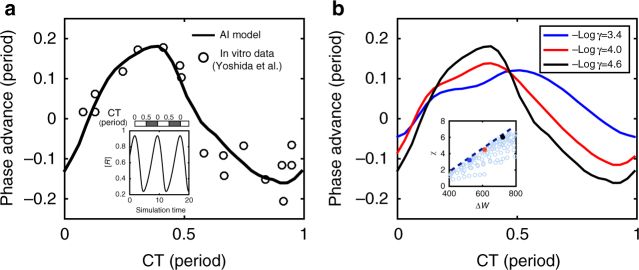
Experimental connection and prediction of the dependence of phase sensitivity on irreversibility γ. a By assuming k1 is increased by 70% and k4 by 30% during a temperature up perturbation (0.1 period), the PRC from the AI model (black line) can be fitted to that of a temperature up PRC (symbols) observed in57. Simulation trajectory of oscillation along with the circadian time scale are shown in the inset. The peak of activator rhythm is defined as CT 0. Experimental PRC data from ref. 57 is aligned with the model PRC to peak at the same CT. b PRCs for the same perturbation as in a is computed for different background levels of ATP/ADP ratio or equivalently different values of γ (given in the legend). The extra free-energy dissipation for each γ choice are: ΔW − Wc ≈ 170 (blue); 250 (red); 350 (black, same as in a). Amplitude of PRC increases as sensitivity χ is enhanced by or ΔW as shown in the inset, where the hollow circles correspond to different choices of (γ1, γ2). This prediction can be tested experimentally

