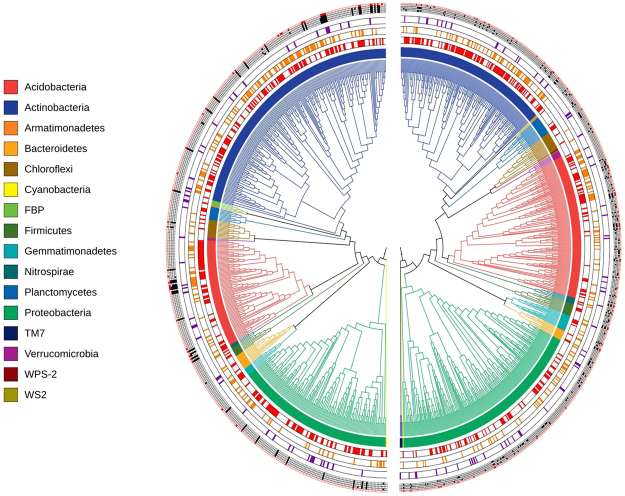
Figure 4.
Phylogenetic trees of bacterial networks from Section 1 and 2. (Left) Section 1 network phylogenetic tree; (Right) Section 2 network phylogenetic tree. From the innermost semi-circles: semi-circle (1) and internal tree colors illustrate the taxonomy (phylum) of each OTU; semi-circle (2) shows the type of distribution of every OTU in the network: core (red) or noncore (white); semi-circle (3) illustrates the abundance of every OTU: highly abundant (>0.1% relative abundance in orange) or lowly abundant (<0.1% relative abundance in white); semi-circle (4) shows the centrality value of every OTU: highly connected (>10% higher centrality values in purple) or lowly connected (<10% centrality values in white); semi-circle (5) illustrates correlation values of OTUs relative abundance with abiotic variables (from innermost: Fe, Cu, Zn, N and pH): highly correlated (>10% significant values in black for Fe, Cu, Zn and N; for pH in red) or lowly correlated (<10% significant values in white).

