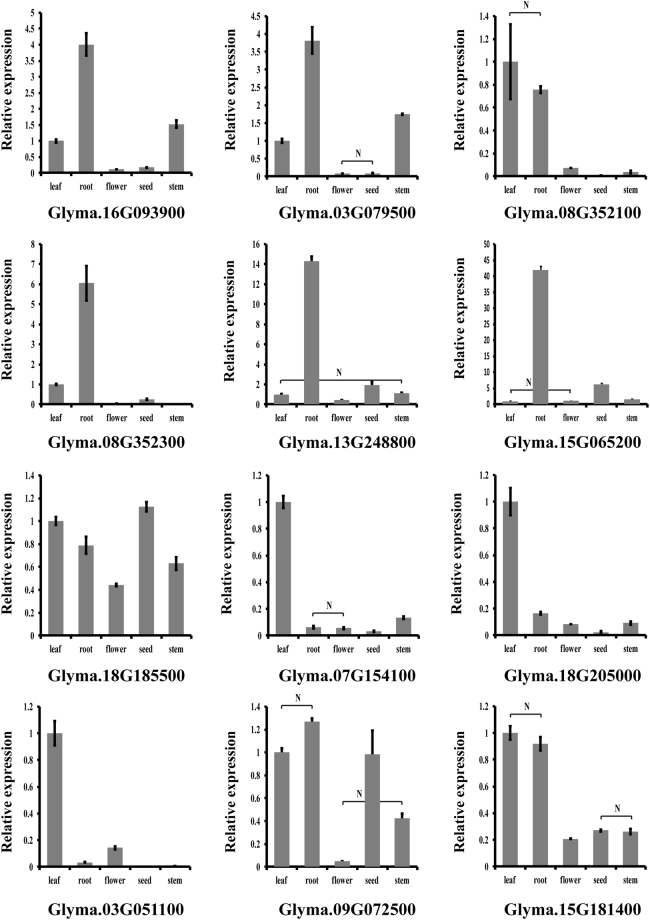
Figure 8.
Transcription level of 12 LecRLK genes in various tissues as analyzed by qRT-PCR. Gene expression levels were normalized with ACT11 transcript values. Statistical analysis was conducted by t-test to determine the significance of the relative expression of individual genes among different tissues. Since there were significant differences in the expression level for each gene in most pairs of tissues (P < 0.05, t-test), only pairs of tissues between which there was no significant difference in expression were marked by N.

