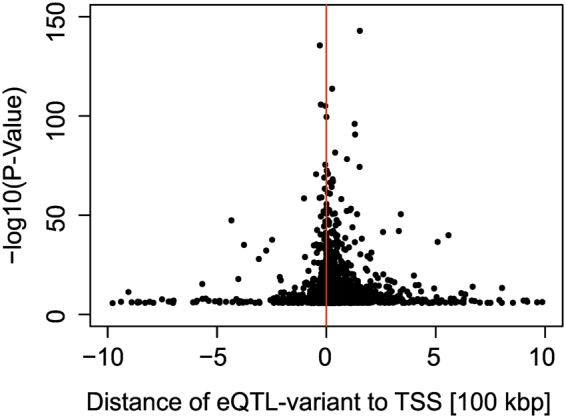
Figure 2.

Characterisation of independent signal eQTL variants based on their genomic localisation. The distance to the nearest transcription start site (TSS) is plotted against the −log10 P-Values of the most significant variant at each eQTL gene, including secondary signals (independent hits). Negative/positive distances denote that the variant is located upstream/downstream of the TSS with regard to the direction of transcription.
