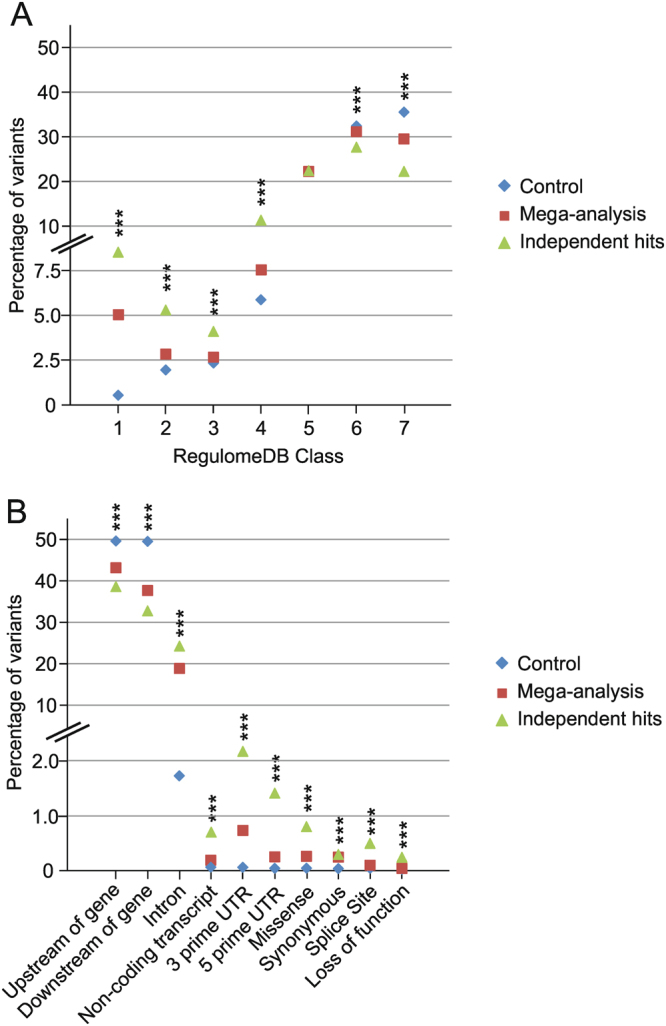
Figure 3.

Functional annotations and predicted consequences of local eQTL-variants. Three sets of variants were evaluated by employing two different databases. Set one (control) includes random variants of the imputed genotype file, which are located next to at least one gene within a distance of a maximum of 1 Mb. Set two (mega-analysis) consists of all significant mega-analysis (Q-Value < 1 × 10⁻³) eQTL variants while the third group comprises the most significant variant of each independent hit (including the independent secondary signal variants). (A) The chart depicts the percentage of variants per variant set categorised into seven groups by RegulomeDB. The seven-level functional score is based on a synthesis of data derived from various sources: category 1 variants are very likely to affect binding and are linked to gene expression of a target gene (i.e. are known eQTL variants); categories 2 and 3 are likely to affect at least transcription factor binding and several other regulatory effects; categories 4–6 show minimal functional indication while category 7 variants lack evidence for any functional relevance. (B) The chart shows the percentage of variants classified into ten classes of consequences according to the Ensembl Variant Effect Predictor (VEP). For variant set two (mega-analysis) and three (independent hits) we only included the predicted consequence affecting the identified eQTL gene. For the control group, one random gene within a variant–gene distance of a maximum of 1 Mb was chosen. We selected the most severe effect, if the variant had different effects on transcripts of the same gene. ***P-Value for difference between groups <0.001.
