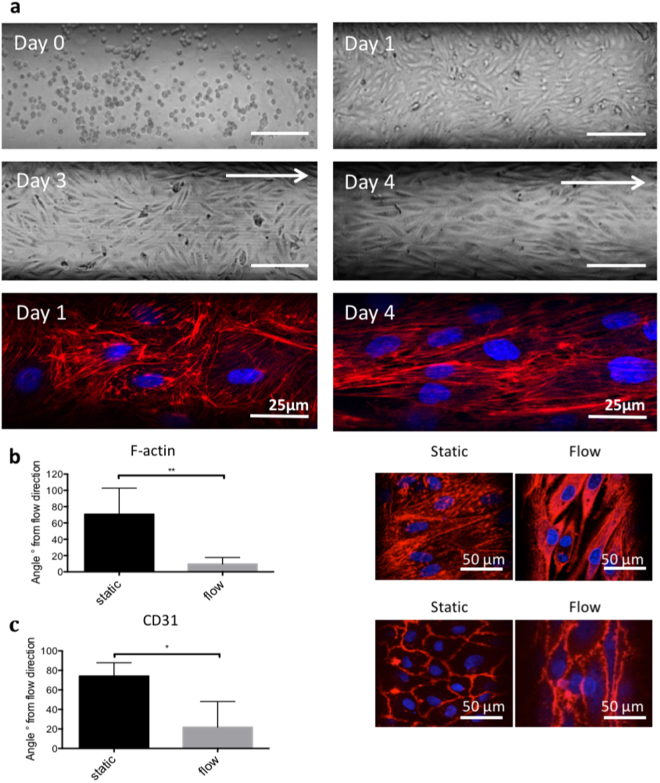
Figure 2.
Cell morphology and quantification of cell alignment. (a) Cell morphology over time. (a) day 0, cells are randomly distributed immediately after seeding; (b) day 1, cells attach and elongate under static conditions; (c) day 3, cells start to become aligned under flow for one day; (d) day 4, most of the cells are aligned under flow for two days. Arrows indicate the direction of pulsatile flow in the microfluidic channels. (e) F-actin staining of PAEC in static conditions and (f) under flow. If not specified scale bar represents 100 µm. (b,c) Quantification of cell alignment to the x-axis of the microfluidic channels by immunofluorescence staining for the cytoskeleton protein F-actin and CD31, respectively. On the left panel, column graphs of the average cell angle in degrees to the x-axis are shown under static and pulsatile flow conditions (mean values ± SD, p-value: * < 0.05, ** < 0.01). Representative immunofluorescence images are shown on the right panel (a-b). Arrows show the flow direction. Scale bar represents 50 µm.

