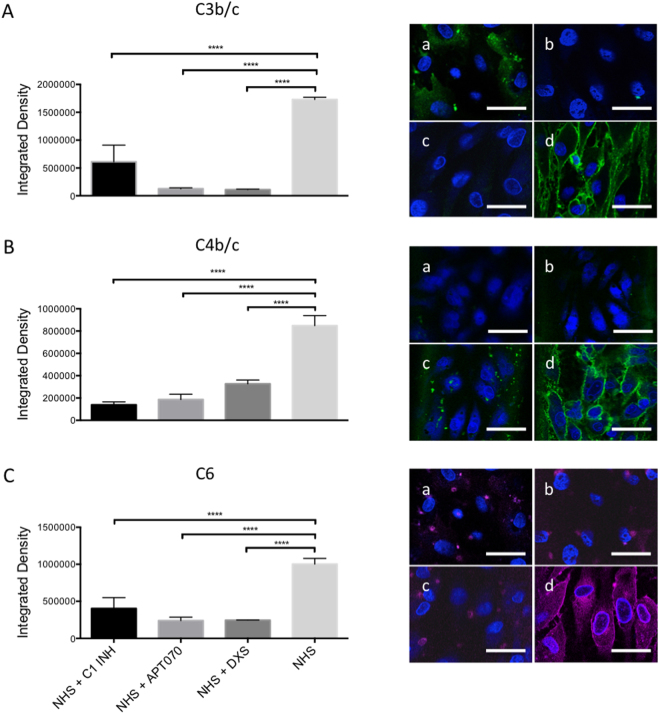
Figure 5.
Deposition of C3b/c, C4b/c, and C6 on PAEC assessed by immunofluorescence after perfusion with NHS with or without complement inhibitors. Column graphs on the left panels show quantification of immunofluorescence staining for deposition of C3b/c (A), C4b/c (B) and C6 (C). Shown are mean values ± SD with indication of statistically significant differences between complement inhibitor groups and NHS alone. ****p < 0.0001, n = 5. Representative images are shown on the right panels. PAEC in microfluidic channels were perfused for 60 min with 1:10 NHS + C1 INH (a), 1:10 NHS + APT070 (b), 1:10 NHS + DXS (c), and 1:10 NHS alone (d). Sera from different donors with different blood groups were used as pool of 8 donors. Scale bar represents 50 µm.

