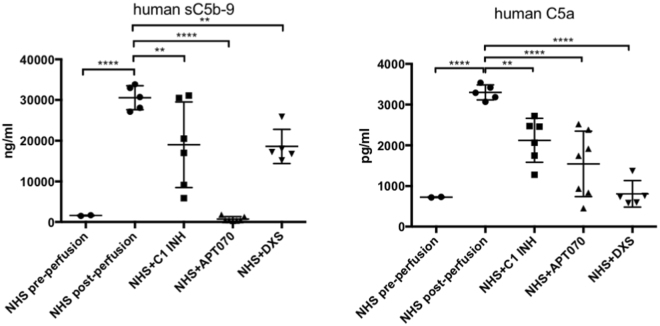
Figure 7.
Concentrations of soluble complement markers after perfusion with NHS with or without complement inhibitors. Human soluble complement activation markers in the perfusate were detected by ELISA (human C5a) and Bio-Plex [human soluble (s)C5b-9]. Data are presented as scattered dot plot with mean values, error bars indicate standard deviations, NHS post-perfusion n = 5, NHS + C1INH n = 6, NHS + APT070 n = 7, NHS + DXS n = 5, p-values: **p < 0.01, ****p < 0.0001. Sera from different donors with different blood groups were used as pool of 8 donors.

