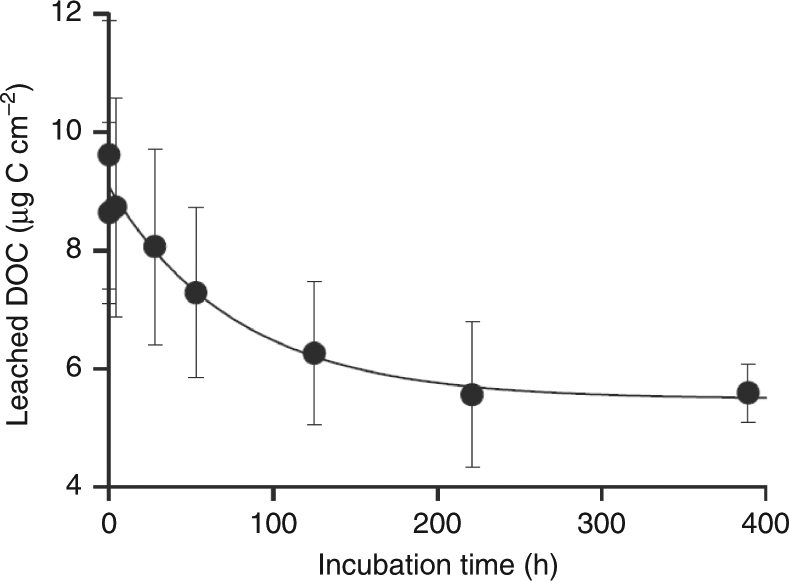
Fig. 1.

Loss of DOC over time using LDPE. The original DOC concentration of the artificial seawater before plastic addition was subtracted from all the points. Thus, the first point represents the maximum leaching after the plastic addition. Error bars show the standard deviation of the mean of three replicates. First order rate constant = −0.013 h−1 ± 0.003; R2 = 0.97; p < 0.001. LDPE low-density polyethylene, DOC dissolved organic carbon
