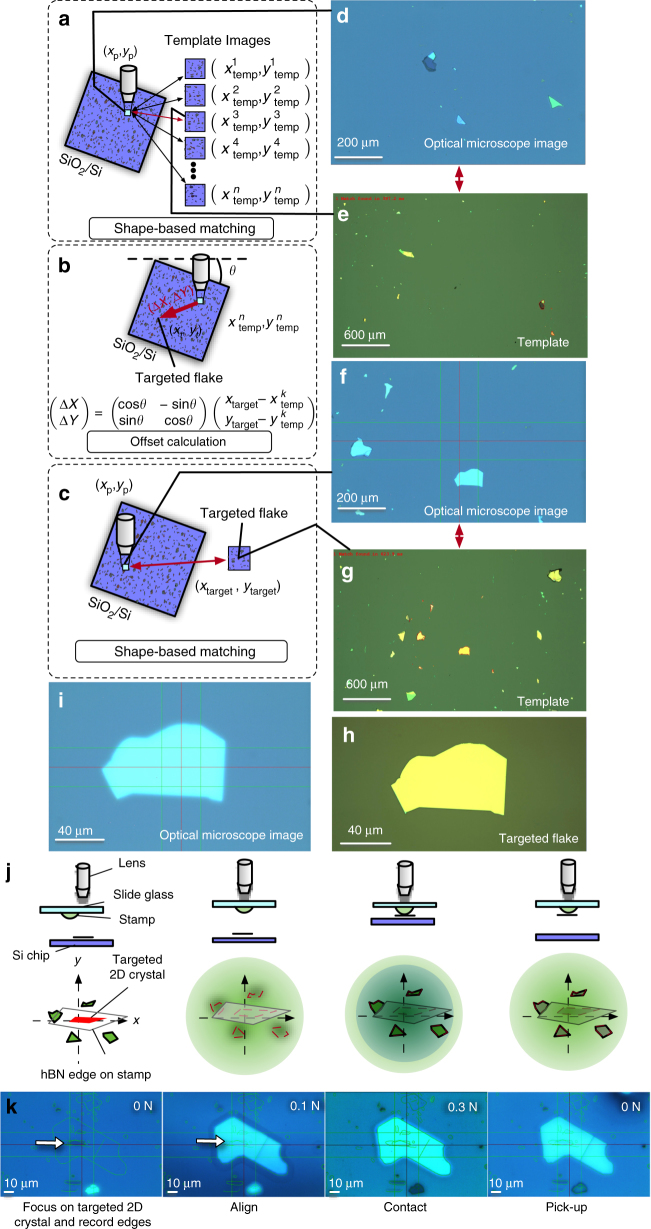
Fig. 7.
Alignment procedure. a Schematic of the matching process conducted to extract the current position of the optical microscope (xp, yp) from the captured image (square filled with light blue). b Geometrical relationship between the targeted flake (xtarget, ytarget) and the extracted position of the optical microscope . c Schematic procedure for aligning the targeted 2D crystal to the optical microscope center. d–e Representative sample of shape-based matching between the optical microscope image (d) and the template image (e). The matched 2D crystal edges are indicated by red curves in e. f, g Representative sample of shape-based matching between the optical microscope image (f) and the template image (g). h Optical microscope image after automated alignment and i template image of the targeted 2D crystal. j Schematics of the alignment procedure to lift targeted 2D crystals. k Optical microscope images obtained at each step of j

