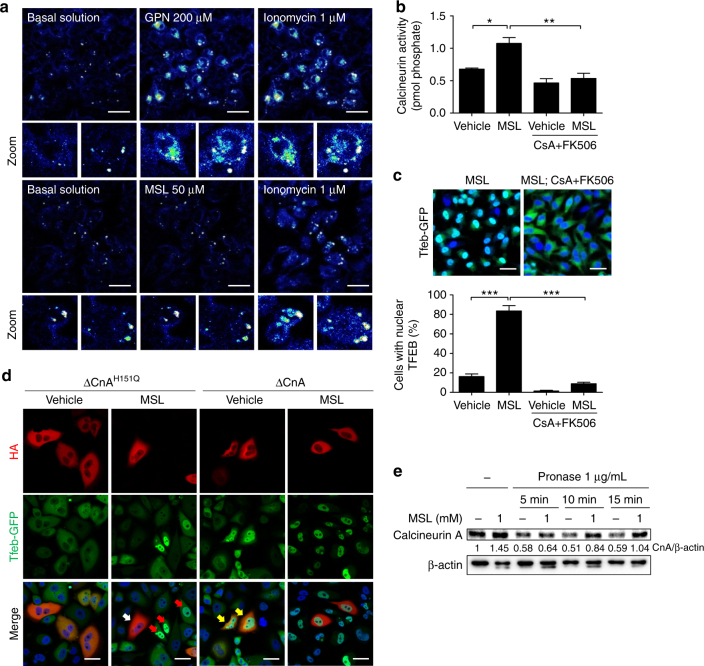
Fig. 2.
MSL-induced calcineurin activation increases autophagic flux. a HeLa cells transfected with GCaMP3-ML1 encoding a lysosome-specific Ca2+ probe were treated with GPN, ionomycin or MSL. Lysosomal Ca2+ release was visualized by confocal microscopy. b Cells were treated with 50 μM MSL with or without pretreatment with CsA + FK506 combination (F = 13.4, df treatment = 3, df residual = 6). c Tfeb-GFP-transfectants were treated with MSL with or without pretreatment with CsA + FK506 combination, and then subjected to confocal microscopy (upper). The number of cells with nuclear TFEB was counted (F = 133.5, df treatment = 3, df residual = 11) (lower). d Tfeb-GFP-transfectants were transfected with HA-ΔCnA-H151Q or -ΔCnA construct, and analyzed by confocal microscopy after treatment with MSL for 4 h and immunostaining with anti-HA antibody (white arrow, HA-ΔCnA-H151Q-transfected cells showing no TFEB translocation by MSL; red arrows, HA-ΔCnA-H151Q-untransfected cells showing TFEB translocation by MSL; yellow arrows, HA-ΔCnA-transfected cells showing TFEB translocation without MSL). e Cell lysate was treated with pronase with or without MSL pretreatment, and subjected to Western blot analysis using anti-calcineurin A antibody. Numbers below immunoblot bands indicate fold changes normalized to β-actin bands (scale bar, 20 μm). All data in this figure are the means ± s.e.m. from ≥3 independent experiments performed in triplicate. *P < 0.05, **P < 0.01 and ***P < 0.001 by one-way ANOVA with Tukey’s post-hoc test

