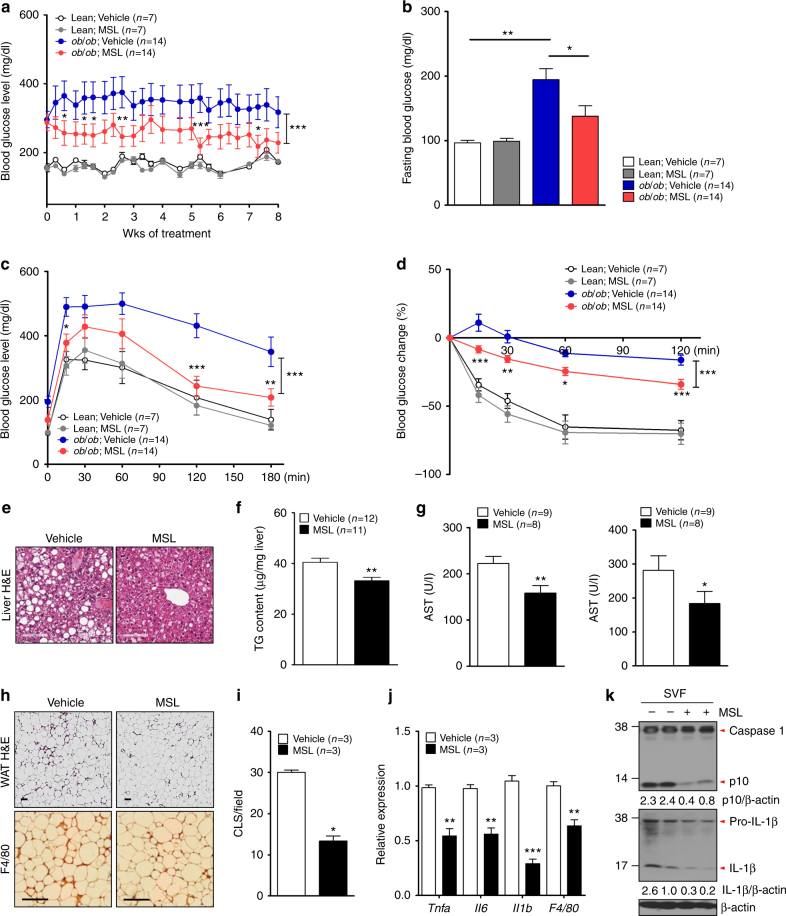
Fig. 4.
Improved metabolic profile of ob/ob mice by administration of autophagy enhancer. a Nonfasting blood glucose level of ob/ob mice treated with MSL (F = 178.3, df = 1). b Fasting blood glucose level after MSL treatment for 8 weeks (F = 8.3, df treatment = 3, df residual = 38). c IPGTT after the same treatment (F = 49.5, df = 1). d ITT after the same treatment (F = 48.4, df = 1). e Hepatic H&E-stained sections from MSL-treated ob/ob mice. f Hepatic triglyceride content (t = 3.5, df = 22). g Serum AST/ALT levels (t = 3.7, df = 15 for AST; t = 2.3, df = 15 for ALT). h H&E staining (upper) and immunohistochemistry using F4/80 antibody (lower) of adipose tissue from ob/ob mice treated with MSL for 8 weeks. i Numbers of CLSs in F4/80 antibody-stained sections (t = 9.4, df = 2). j Expression of cytokines in adipose tissue determined by real-time RT-PCR (t = 6.3, df = 4 for Tnfa; t = 6.5, df = 4 for Il-6; t = 11.4, df = 4 for Il-1β; t = 5.5, df = 4 for F4/80). k Inflammasome activation in adipose tissue examined by Western blot analysis. Numbers below immunoblot bands indicate fold changes of cleaved caspase 1 (p10) or mature IL-1β bands normalized to β-actin bands. All data in this figure are the means ± s.e.m. from ≥3 independent experiments performed in triplicate (scale bar, 100 μm). *P < 0.05, **P < 0.01 and ***P < 0.001 by two-way ANOVA with Bonferroni’s post-hoc test (a, c, d), one-way ANOVA with Tukey’s post-hoc test (b) or two-tailed Student’s t-test (f, g, i, j)

