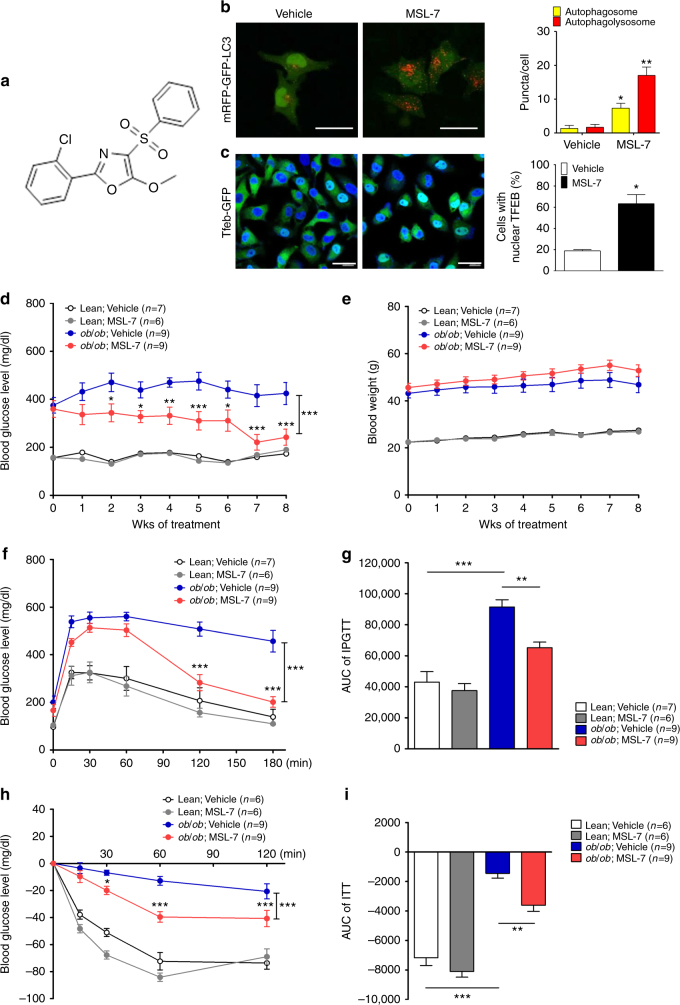
Fig. 5.
Improved metabolic profile after in vivo administration of autophagy enhancer with increased microsomal stability (MSL-7) to ob/ob mice. a Chemical structure of chemically modified autophagy enhancer, MSL-7, with increased microsomal stability [2-(2-chlorophenyl)-5-methoxy-4-(phenylsulfonyl)oxazole]. b HeLa cells transfected with tandem mRFP-GFP-LC3 construct were treated with MSL-7 for 1 h, and were subjected to confocal microscopy (left panel). The numbers of yellow and red punctae representing autophagosomes and autophagolysosomes, respectively, were counted (right) (t = 3.5, df = 4 for autophagosome; t = 5.8, df = 4 for autophagolysosome). c TFEB-GFP-transfectant HeLa cells were treated with MSL-7 for 4 h, and were subjected to confocal microscopy (left panel). The number of cells with nuclear TFEB was counted (right) (t = 5.0, df = 2). d, e Eight-week-old male ob/ob mice or 8-week-old male C57BL/6 mice were treated with 50 mg/kg MSL-7 3 times a week for 8 weeks, and nonfasting blood glucose level (d) and body weight (e) were monitored (F = 40.9, df = 1 for d). f IPGTT was conducted after in vivo administration of MSL-7 for 8 weeks (F = 62.3, df = 1). g AUC of the IPGTT curve in f (F = 25.3, df treatment = 3, df residual = 27). h ITT was conducted after in vivo administration of MSL-7 for 8 weeks (F = 50.1, df = 1). i AUC of the ITT curve in h (F = 57.7, df treatment = 3, df residual = 26). All data in this figure are the means ± s.e.m. from ≥3 independent experiments performed in triplicate (scale bar, 20 μm). *P < 0.05, **P < 0.01 and ***P < 0.001 by one-way ANOVA with Tukey’s post-hoc test (g, i), two-way ANOVA with Bonferroni’s post-hoc test (d, f, h) or two-tailed Student’s t-test (b, c)

