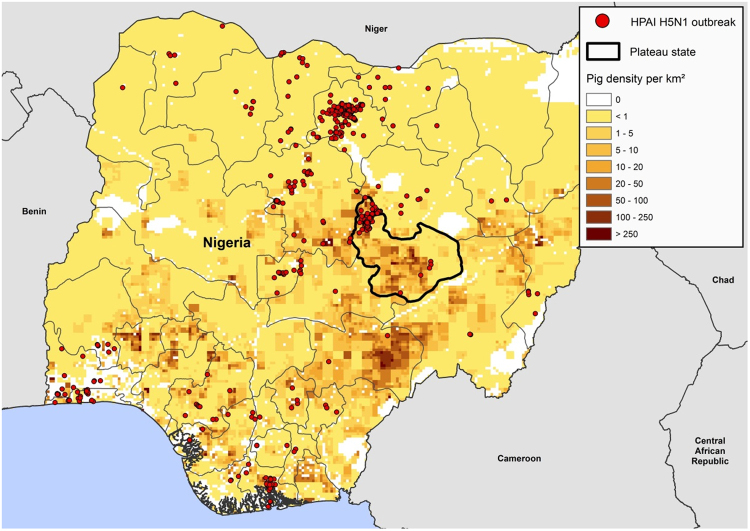
Figure 3.
Map of Nigeria, Plateau state, source of pigs to the slaughterhouse. Colour bar shows density of pigs in the state while dots indicate spatial distribution of HPAI H5N1 outbreaks in poultry in 2015–201611,12,45. Map generated with ArcGIS (Software: ArcGIS 10.3 by ESRI- https://www.esri.de/support-de/produkte/arcgis-for-desktop-10-3). Data source: Global Administrative Areas (http://www.gadm.org/)46 and Global Pig Density (2005) – GeoNetwork by FAO (http://www.fao.org/geonetwork/srv/en/main.home).

