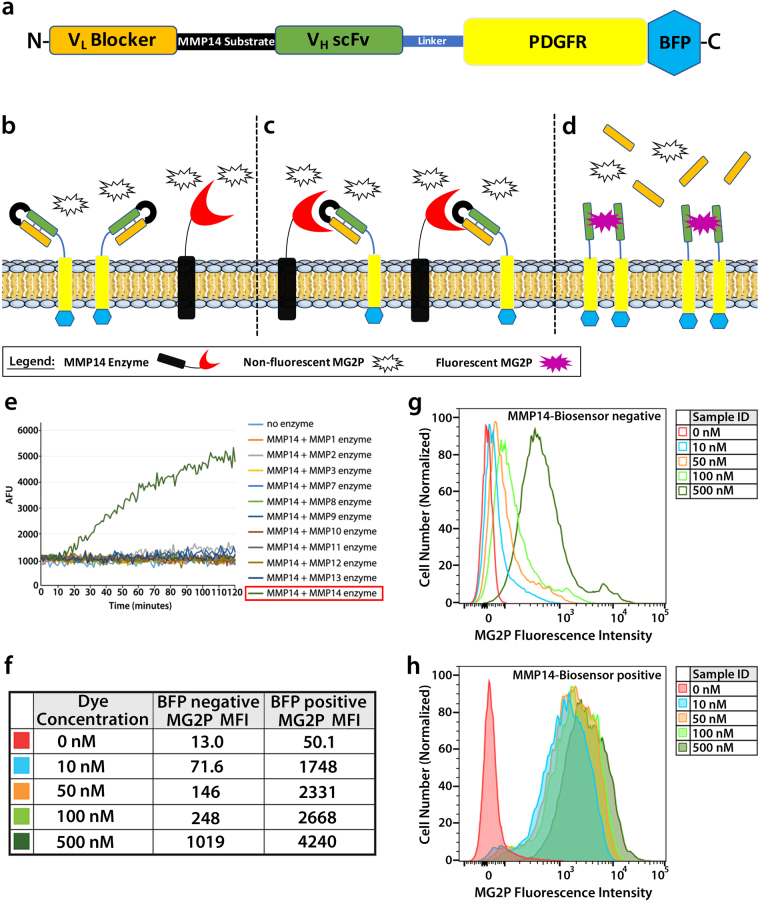
Figure 1.
Development of a fluorogen activating protein-based biosensor. (a) Schematic diagram of the MMP14 biosensor subdomains and their relative positions (N-terminal to C-terminal; left to right) within the protein. (b–d) Schematic diagram showing the transmembrane MMP14 biosensor in the presence of MG2P dye when the biosensor is uncleaved (b), when the biosensor is in the process of being cleaved by the MMP14 enzyme (c), and when the cleaved MMP14 biosensor is bound to MG2P dye (d). (e) Tecan fluorimetry of soluble biosensor incubated with various catalytically active MMP enzymes showing specificity for MMP14. AFU = Arbitrary Fluorescence Units. (f–h) Cells were analyzed by flow cytometry to quantify total fluorescent signal from the biosensor. The level of MG2P fluorescence was determined for live BFP negative cells (f,g) or live BFP positive cells (f,h) and displayed as a histogram showing the number of cells versus MG2P fluorescence intensity (g,h). Color traces represent data from each of the different concentrations of dye used (0, 10, 50, 100 or 500 nM). MFI = Mean Fluorescence Intensity.

