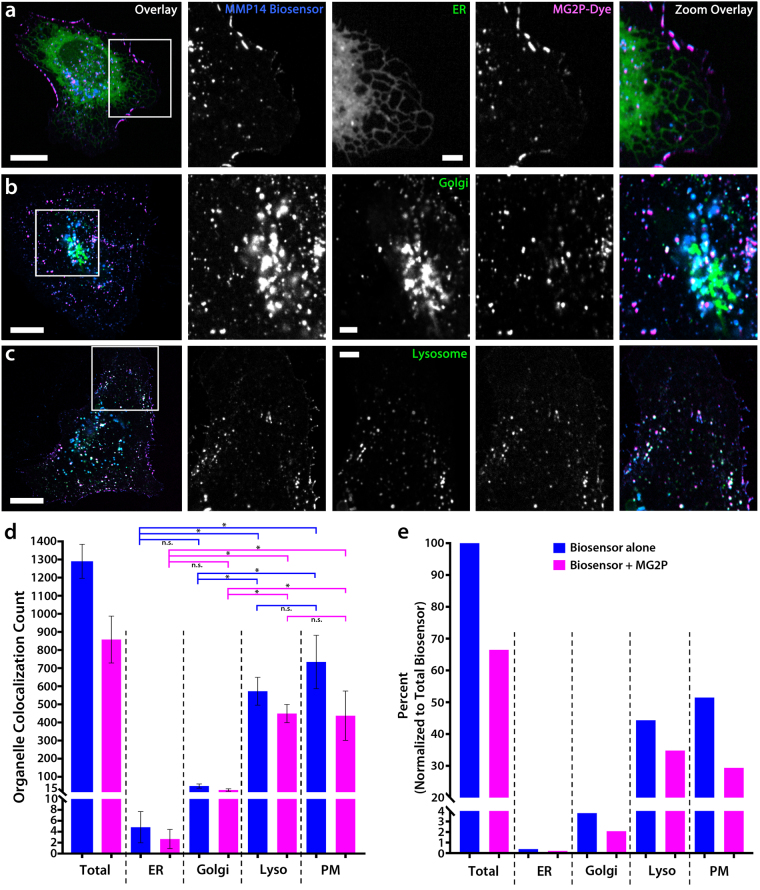
Figure 2.
The MMP14 biosensor is trafficked through normal exocytic and endocytic pathways. (a–c) Whole-cell image overlays (far left) and zoomed regions of the cell (white boxes) showing colocalization imaging of HUVECs expressing the MMP14 biosensor, MG2P dye, and a fluorescent marker for either the endoplasmic reticulum (ER; a), the Golgi-apparatus (b), or lysosomes (c). The color of the text in each panel indicates the fluorescent color shown in the Overlay images. (d–e) Quantification of the total number of MMP14 biosensor and dye-bound biosensor and their distributions in ER (n = 6), Golgi (n = 5), lysosomes (n = 4), and the plasma membrane (PM; n = 15). (e) Distributions of MMP14 biosensor and dye-bound biosensor shown as a percentage of the total MMP14 biosensor localized within each of the cellular organelles. Scale bars = 20 µm (whole cell); 5 µm (zoomed). P < 0.01. Error bars = + /− SD.

