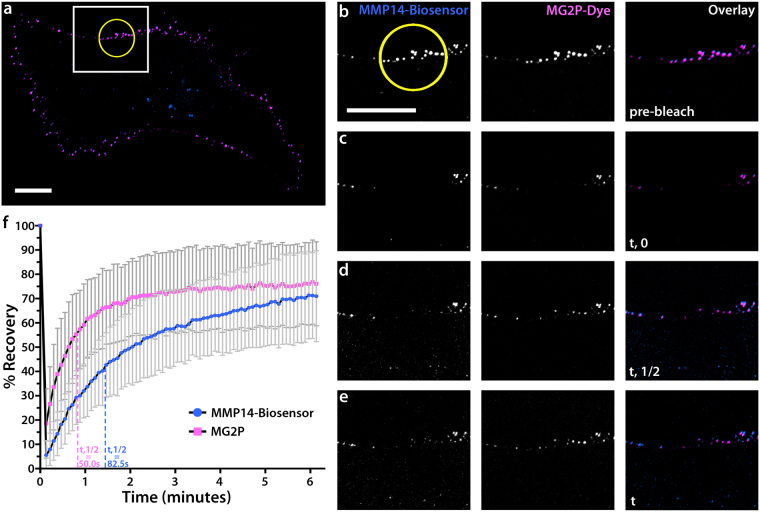
Figure 3.
MMP14 biosensor binding of MG2P dye on the EC surface is dynamic. (a) Whole-cell image of an EC expressing MMP14 biosensor in the presence of MG2P dye. White box represents the zoom regions shown in (b–e). Yellow circle is the region of photobleaching. (b–e) Zoomed regions from (a) showing example grayscale images of MMP14 biosensor, MG2P dye, and Overlay at defined times during the FRAP experiment: (b), pre-bleach; (c), immediately following the photo-bleach (t, 0); (d), half time of final measured fluorescence recovery (t, ½); (e), total time of final measured fluorescence recovery (t). (f) Fluorescence recovery graph for the MG2P dye (pink) and the MMP14-biosensor (blue). Vertical dashed lines represent the position of t,1/2 for MG2P dye (pink) and the MMP14-biosensor (blue). Scale bars = 20 µm. Error bars = + /− SD.

