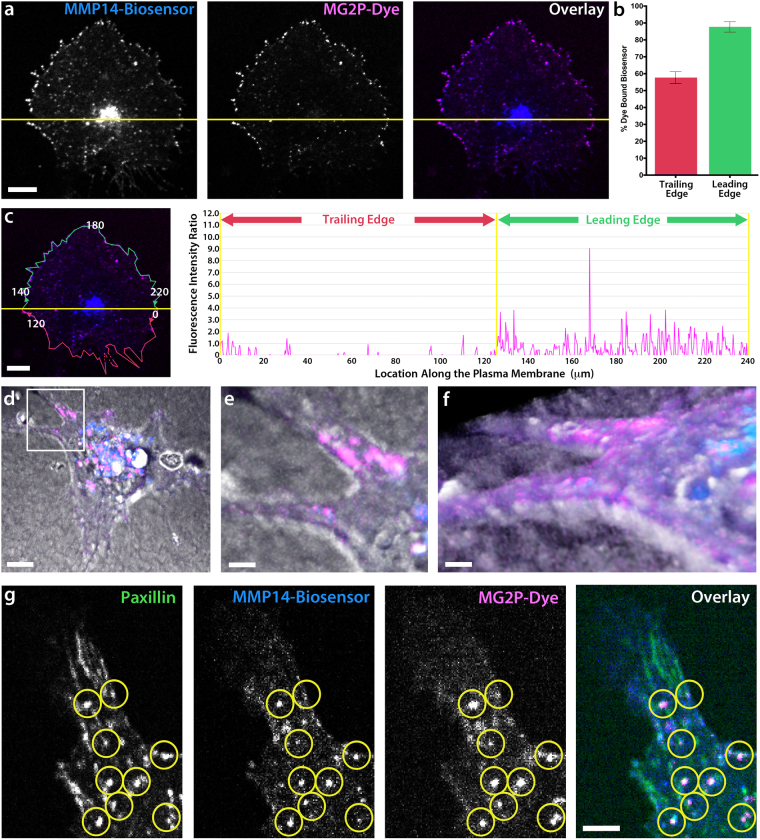
Figure 5.
MMP14 is locally activated in polarized ECs. (a) Grayscale images of BFP-MMP14 biosensor, MG2P dye, and Overlay in a polarized HUVEC. The cell is divided by a yellow line into the leading edge (top) and trailing edge (bottom). (b) Quantification of the percent of dye-bound biosensor within the trailing edge and leading edge of ECs (n = 3). (c) Image of a cell (left panel) and intensity profile graph (right panel) showing the fluorescence intensity ratio of MMP14 biosensor and MG2P dye within the trailing edge and leading edge of the cell. Red line (left panel) is a cell perimeter mask of the trailing edge and green line (left panel) is a cell perimeter mask of the leading edge that is depicted in the intensity profile graph. Numerical values shown in (c, left panel), are provided for reference to the x-axis values within the intensity profile graph (right panel), which mark the location under the line (in microns) relative to the cell perimeter. (d–f) 3D z-stack whole cell image (d) showing a HUVEC expressing biosensor in a 3D type-I collagen ECM. Blue label is MMP14-Biosensor; Pink label is MG2P dye. (e) Zoomed image (white box in d) showing dye-bound biosensor within a branched protrusion at the interface of the cell and ECM, and a rotation of the same 3D zoomed image (f). (g) Grayscale images of a HUVEC branched protrusion showing a focal adhesion marker (GFP-Paxillin, left panel), BFP-MMP14 biosensor (left middle panel), MG2P dye (right middle panel), and Overlay (right panel). Yellow circles highlight focal adhesion structures that are colocalized with both the MMP14 biosensor and the MG2P-dye. (a,c,d) Scale bars = 20 µm. (e,f,g) Scale bars = 5 µm.

