
FIGURE 3.
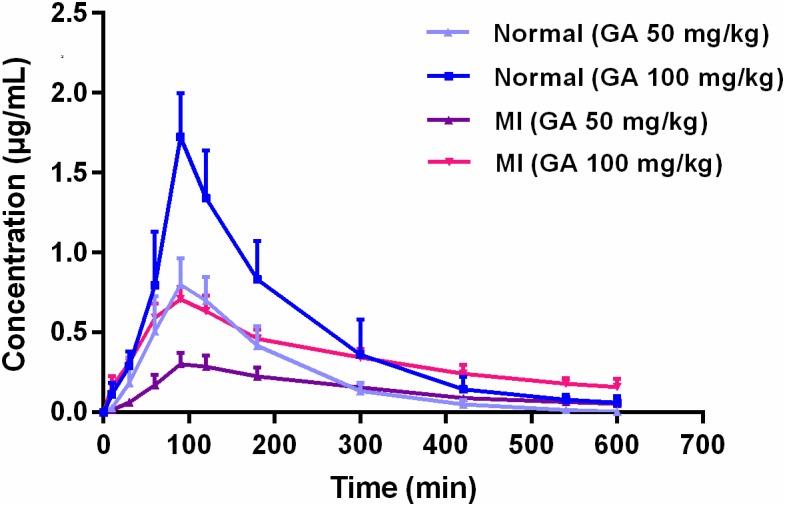
Mean plasma concentration-time profiles of gallic acid in normal and MI rats after oral administration of 50 and 100 mg/kg GA, respectively.
Official websites use .gov
A
.gov website belongs to an official
government organization in the United States.
Secure .gov websites use HTTPS
A lock (
) or https:// means you've safely
connected to the .gov website. Share sensitive
information only on official, secure websites.
Mean plasma concentration-time profiles of gallic acid in normal and MI rats after oral administration of 50 and 100 mg/kg GA, respectively.