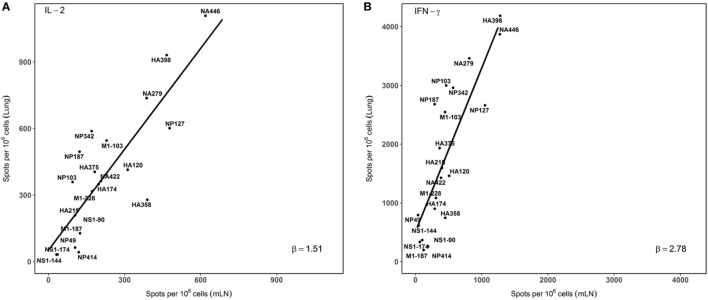
Figure 4.
Immunodominance hierarchy of epitope specific CD4 T cells isolated from draining lymph node (dLN) is preserved in the lung lung. IL-2 and IFN-γ Elispots were performed as described from cells isolated at day 10–11 postinfection. Individual values for IL-2 (A) or IFN-γ (B) EliSpots from three independent experiments from Figure 2, with the SD values indicated in Figure 2. The average values were tabulated and analyzed using linear regression models, using each data point. The slopes of the derived line (“β”) were calculated and are indicated in each panel. Shown are the average values of spots per million CD4 T cells for each epitope data set tested. (A) beta (slope) = 1.51. r2 = 0.63. p value < 0.001. (B): beta (slope) = 2.78, r2 = 0.64. p value < 0.001.

