Figure 5.
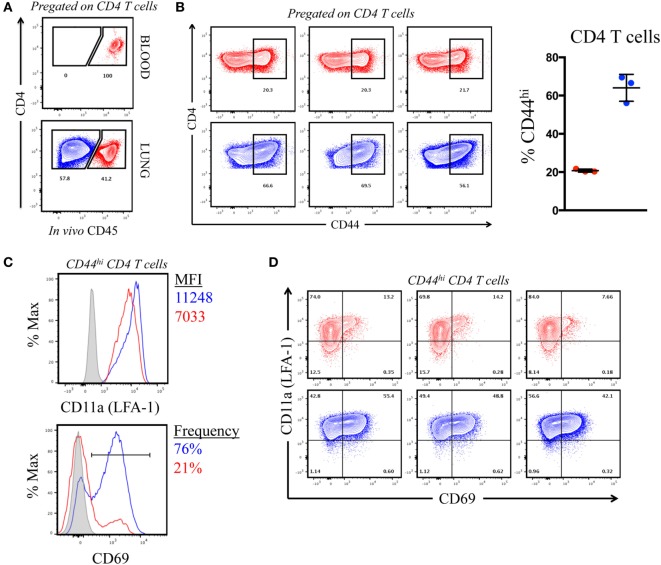
Intravenously (IV) labeling reveals distinct compartmentalization and phenotype of pulmonary CD4 T cells following infection. (A) Representative IV CD45-fAPC staining profile from pre-gated, CD4+ T cells in blood and lung following infection, where blue denotes “protected” cells and red denotes “labeled” cells. (B) Contour plots (CD4 vs. CD44) (pre-gated on CD4+) and tabulated frequency of CD44hi CD4 T cells from three individual mice, shown at right. Symbols represent individual animals and error bars reflect standard deviation from the mean. (C) CD11a (LFA-1) MFI,% CD69+ (from CD44hi CD4 T cells), and expression profile of CD69 vs. CD11a (LFA-1) on IV “labeled” and “protected” cells 10 dpi. Histograms reflect pooled responses from three animals and individual contour plots (D) reflect responses from the three individual animals.

