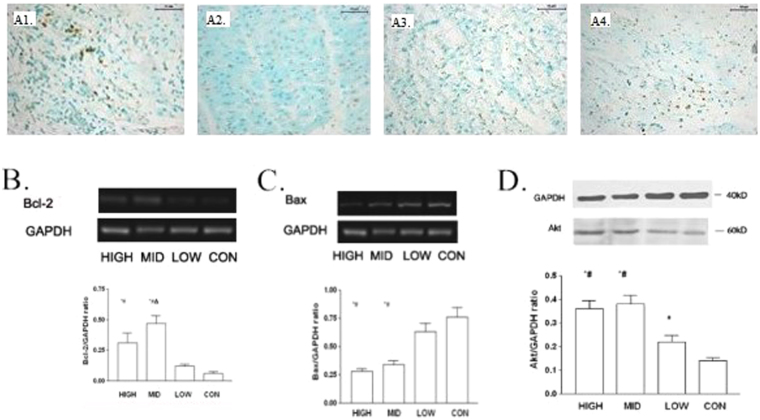
Figure 3.
Myocardial apoptosis in infarction border zone, eight weeks post-modeling. (A) Myocardial apoptosis in infarct border zone, TUNEL staining, 200×. (A1) Control group. (A2) Low dose group. (A3) Middle dose group. (A4) High dose group. (B) Expression of Bcl-2 mRNA in infarction border zone measured by RT-PCR CON = control, LOW = low dose group, MID = middle dose group, and HIGH, high dose group. *p < 0.05 compared with control group, #p < 0.05 compared with low dose group, and Δp < 0.05 compared with high dose group. (C) Expression of Bax mRNA in infarction border zone measured by RT-PCR CON = control, LOW = low dose group, MID = middle dose group, and HIGH, high dose group. *p < 0.05 compared with control group, #p < 0.05 compared with low dose group, and Δp < 0.05 compared with high dose group. (D) Expression of Akt in infarction border zone measured by western blot. CON = control, LOW = low dose group, MID = middle dose group, and HIGH, high dose group. *p < 0.05 compared with control group, #p < 0.05 compared with low dose group, and Δp < 0.05 compared with high dose group.

