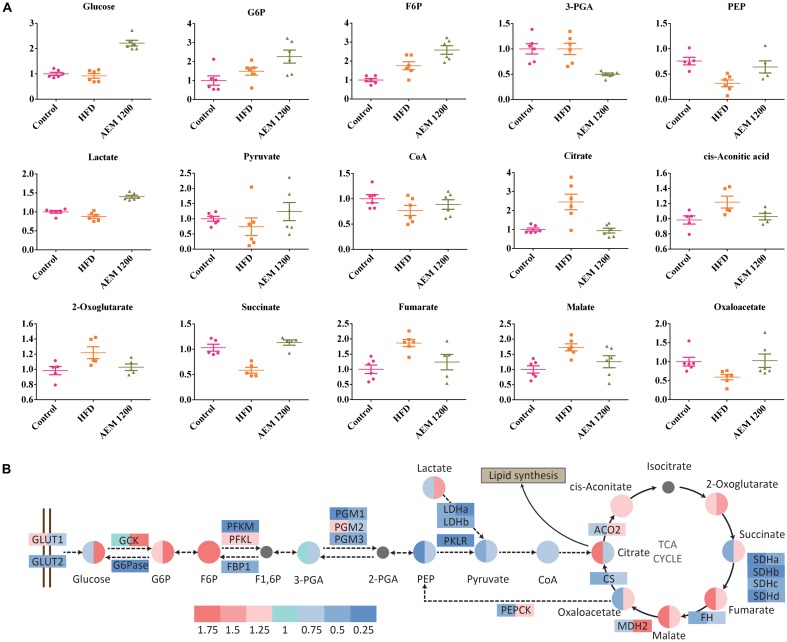
FIGURE 5.
Aqueous extract of black maca (AEM) influences the metabolism of the glycolysis/gluconeogenesis pathway and the TCA cycle. (A) The scatter plot of the relative quantities of the energy metabolites in liver samples from the treated and untreated groups. The Y-axis data were normalized according to the average value of the control. (B) Differential analysis of the glycolysis/gluconeogenesis pathway and the tricarboxylic acid (TCA) cycle among the control group (Con), the HFD model group (HFD), and the 1,200 mg/kg AEM group (AEM 1200). Log2 fold changes of metabolites and the ratios of the average values of gene expression are color-coded, n = 5–6.

