Figure 6.
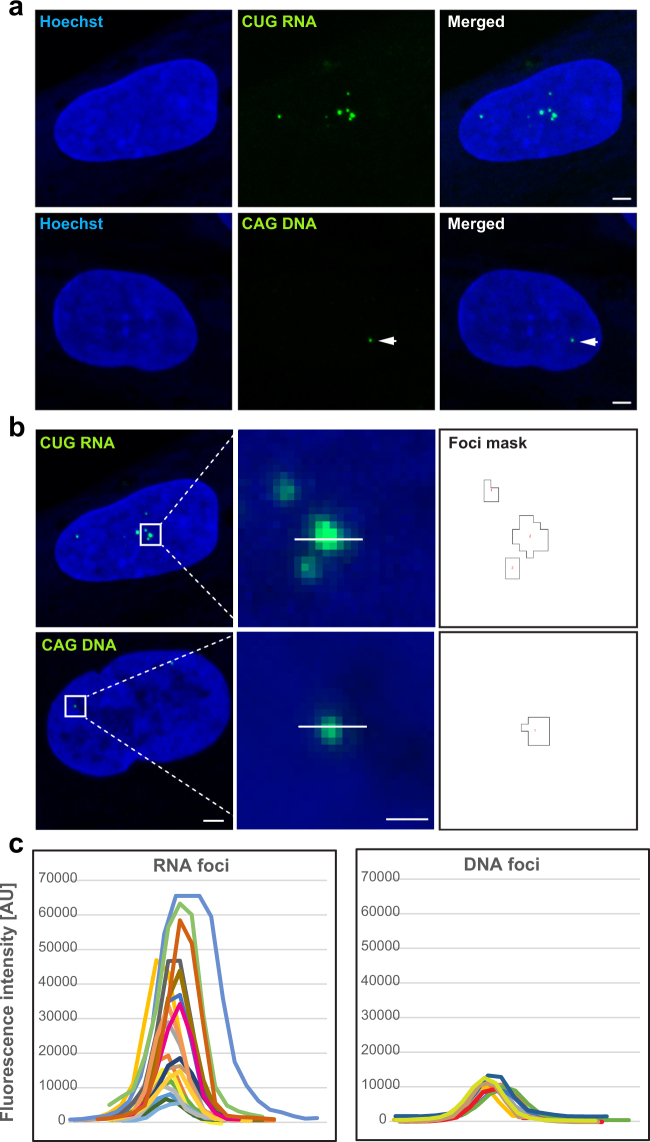
Detection of Mutant CUG Repeat RNA and Mutant CAG Repeat DNA in Nuclear Foci via FISH. (a) Representative FISH images of mutant DMPK RNA and DNA foci in DM1 human fibroblasts. CUG repeat RNA foci were detected with (CAG)10 probe, whereas CAG repeat DNA foci with (CTG)10 probe, both labeled with Alexa 488. The nuclear area was identified by Hoechst stain. The arrowheads indicate dim DNA foci. Scale bar, 2 µm. (b) 16-bit FISH images (raw data) of RNA and DNA foci and their fluorescence intensity in green channel determined by masks with the outline of recognized foci. Scale bars, 2 µm (left panels) and 0.5 µm (middle panels). (c) Maximum values of FISH intensity for RNA and DNA foci from line profiles (as shown in panel b) for randomly selected nuclei of VRS fibroblast cell line. Each plotted color line represents one focus.

